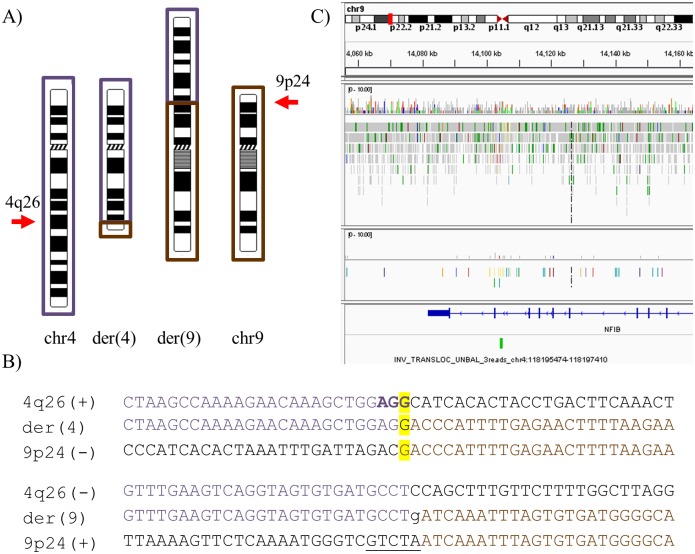
Fig 3. Summarized WG-MPS and Sanger sequencing results in Case 3.
A) Partial ideograms showing the normal and derivative (der) chromosomes (chr) 4 (dark purple) and 9 (brown) (not to scale) in Case 3. 4q26 and 9p24 breakpoints are indicated by arrows. B) Derivative translocation junction sequences (middle line) and matching reference sequences (top and bottom lines) as identified by Sanger sequencing. Microhomology is highlighted in yellow, deleted sequences are underlined, duplicated sequences are in bold letters, and inserted sequences not aligning to either chromosome are in lower-case letters. C) IGV screenshot illustrating the der(9) breakpoint disrupting the NFIB gene within intron 10/10 (NM_001190737.1).

