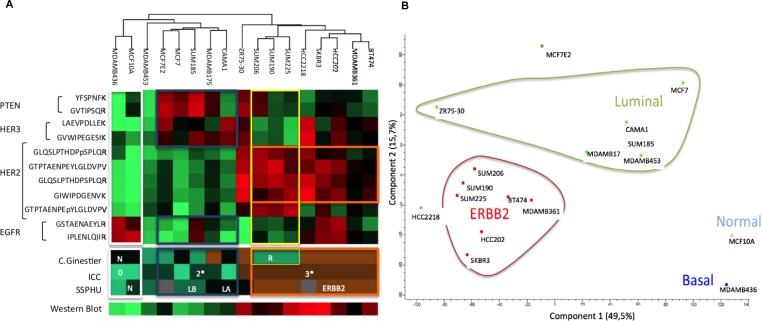
Figure 5. Protein expression of breast cell lines for EGFR, HER2, HER3 and PTEN and the corresponding proteomic classifications of Ginestier, ICC, HER2 expression obtained using western blot and transcriptomic classification SSPHU.
HeatMap (A) and graphic representations of Principal Component analysis (B).

