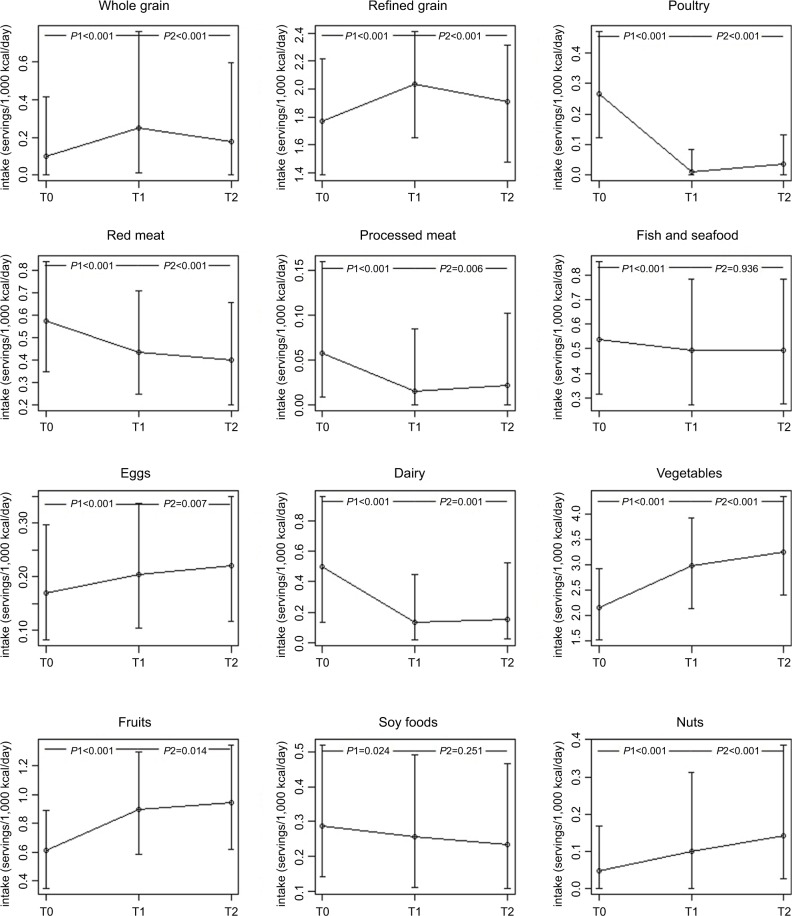
Figure 1.
Dynamic change in the trend of some common food intake during assessments at three time points.
Notes: P1, the comparison between T1 and T0; P2, the comparison between T2 and T1. T0, T1, and T2 represent dietary assessments conducted at baseline, 18-month follow-up postdiagnosis, and 36-month follow-up postdiagnosis, respectively.

