
Figure 6.
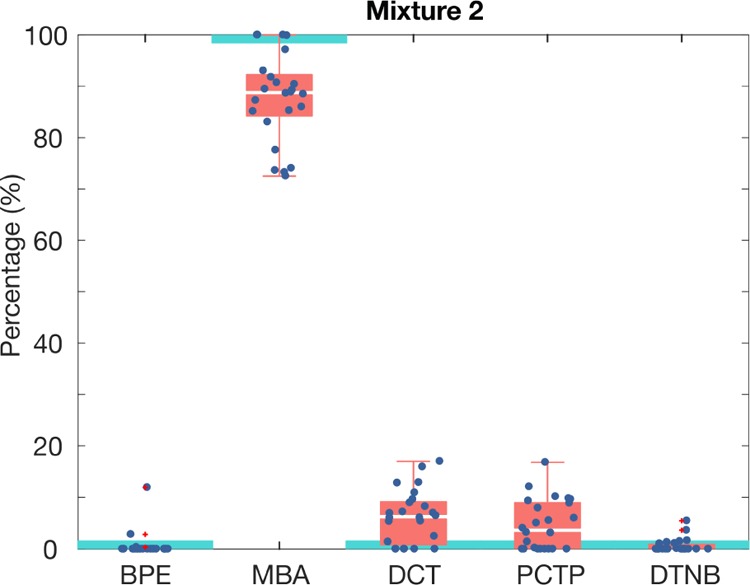
Nanotag ratio estimation for an assay run with an individual nanotag using the LS algorithm where MBA was present at 100% and all other reporters were at 0% (mixture 2). Each data point represents the individual SERS intensities for a region of the test area. Red boxes show 50% of the data between the second (lower limit) and the third quartile (upper limit), and the median (white line). Whiskers indicate the value of the maximum and the minimum. SERS intensities were measured for 30 regions in a test area. Light blue boxes represent the real ratio of reporter in the mixture.