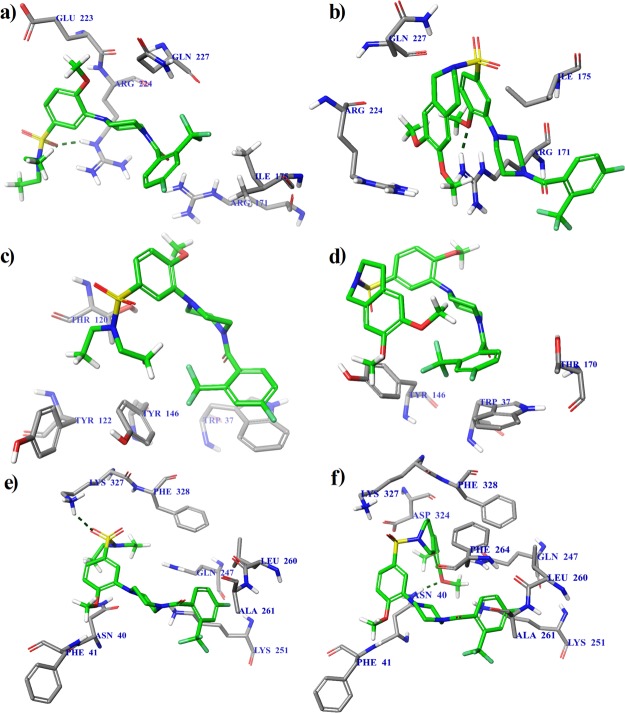
Figure 3.
Calculated binding modes of the protein-ligand complexes: (a) GFRα1–BT13 at the GDNF–GFRα1 interface, region A (ΔGbind = −6.0 kcal/mol); (b) GFRα1-BT18 at the GDNF–GFRα1 interface, region A (ΔGbind = −6.4 kcal/mol); (c) RetA–BT13 at the RetA–GFRα1 interface, region B (ΔGbind = −6.7 kcal/mol); (d) RetA-BT18 at the RetA–GFRα1 interface, region B (ΔGbind = −7.5 kcal/mol); (e) GFRα1–BT13 at the allosteric site, region C (ΔGbind = −7.9 kcal/mol); and (f) GFRα1–BT18 at the allosteric site, region C (ΔGbind = −9.8 kcal/mol). The amino acid residues of protein (PDB code: 4UX8) are colored as gray (carbon), blue (nitrogen), red (oxygen), and white (hydrogen). Intermolecular hydrogen bonds are shown by dashed lines.

