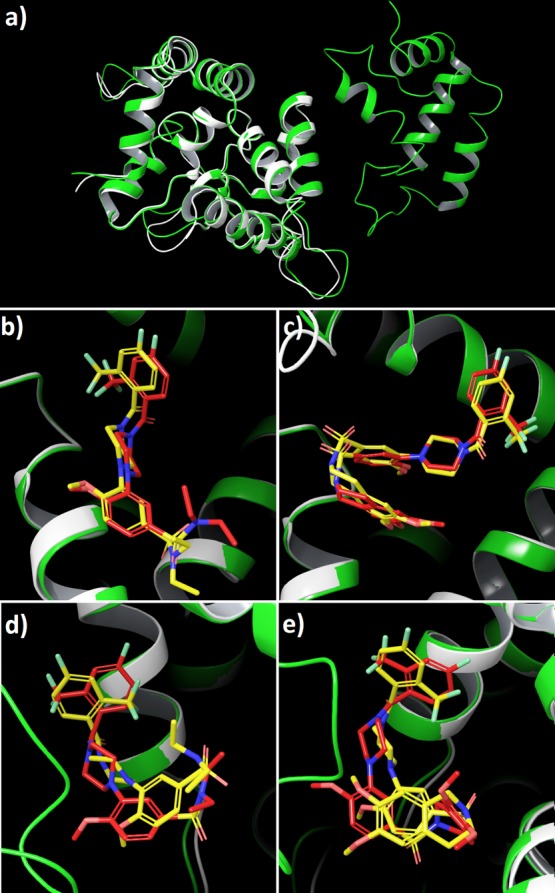
Figure 4.

Comparison of the binding of compounds BT13 and BT18 to protein structures 4UX8 (green) and 3FUB (white). (a) 4UX8 and 3FUB; (b) compound BT13 at the GDNF–GFRα1 interface, region A; (c) compound BT18 at the GDNF–GFRα1 interface, region A; (d) compound BT13 at the allosteric site of GFRα1, region C; (e) compound BT18 at the allosteric site of GFRα1, region C. In each graph (b–e), the ligand conformation with protein structure 3FUB is in yellow and the ligand conformation with protein structure 4UX8 in red.
