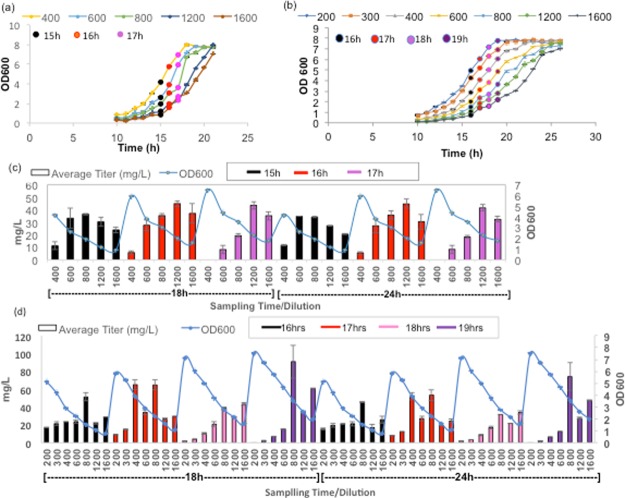
Figure 2.
Growth curve of E. coli (At3GT + PhANS) at different dilutions in AMM supplemented with glucose (a) and glycerol (b) verifying different induction time points. Dynamics of production of C3G at different induction time points with sampling at 18 and 24 h in glucose-supplemented media (c) and glycerol-supplemented media (d). The values are average of three replicates. Error bars represent standard deviation.

