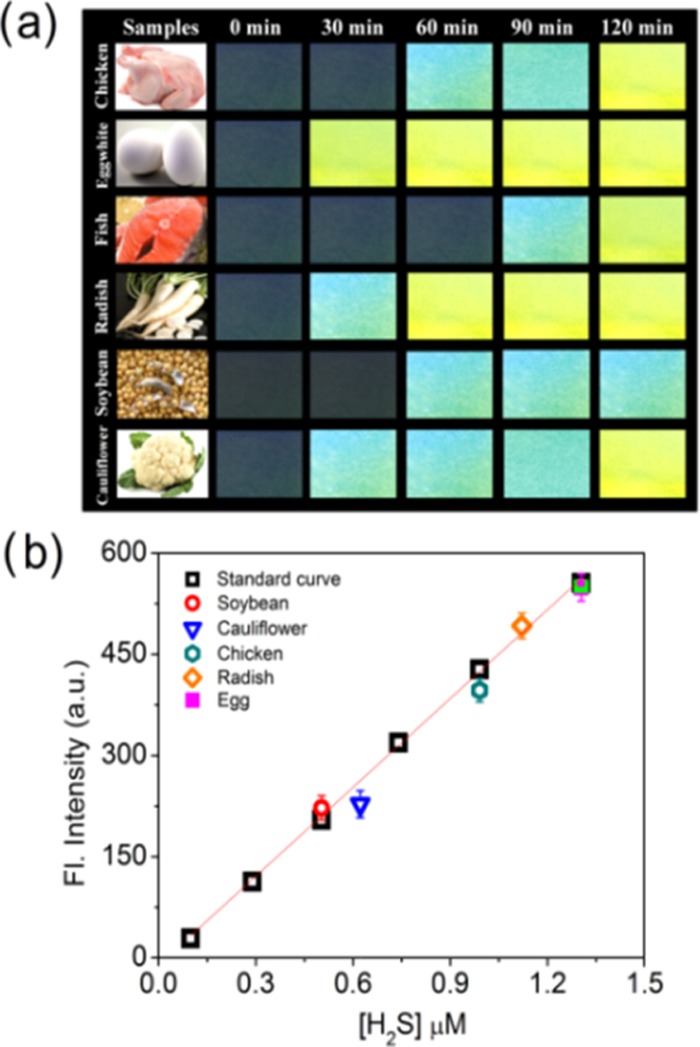
Figure 5.

(a) Images of filter paper strips after consumption of H2S vapor produced from food samples at 30 min interval. (b) Estimation of the concentration of H2S produced from the food samples following the standard curve. Standard deviations (SDs) are given by error bars, where n = 3.
