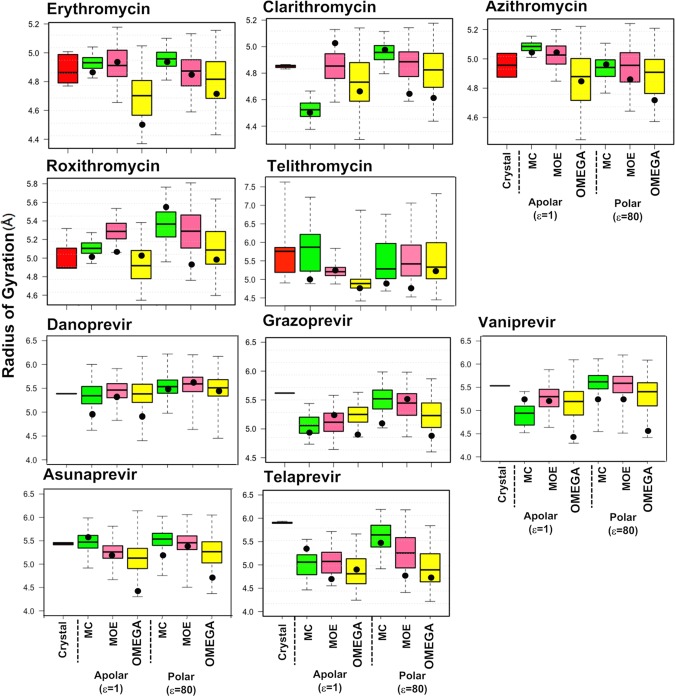
Figure 5.
Radius of gyration (Rgyr) calculated for the erythronolides and HCV NS3/4A protease inhibitors. For each compound, Rgyr has been calculated for the conformation(s) adopted in the crystal structures and for the conformational ensembles generated by MC (green), MOE (pink), and OMEGA (yellow) in apolar and polar environments. Rgyr was calculated using the MOE software.34 Box plots show minimum and maximum values as whiskers; the boxes span the 25th–75th percentile range, and the MECs are indicated as black circles. Figure S2 shows these data plotted with a fixed scale for Rgyr for all 10 compounds.

