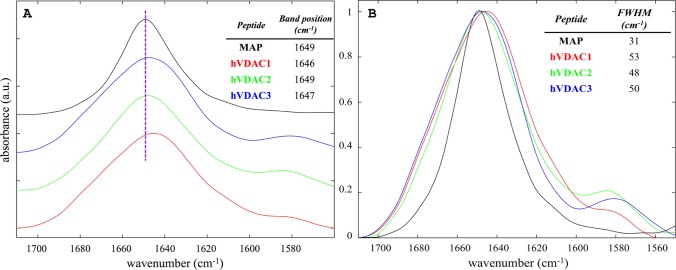
Figure 2.
(A) Stacking plot of the normalized amide I band from samples of hVDAC1(1–25) in red, hVDAC2(12–36) in green, hVDAC3(1–25) in blue, and MAP in black. Spectra were acquired in the presence of LUVs with 20%mol POPG and 80%mol POPC, at a lipid/peptide molar ratio of 10 and a total peptide concentration of 2 mM. The table reports the position of the maximum and a dashed line centered to that of MAP is shown as a reference. (B) The same spectral region for the four samples in A are superimposed.

