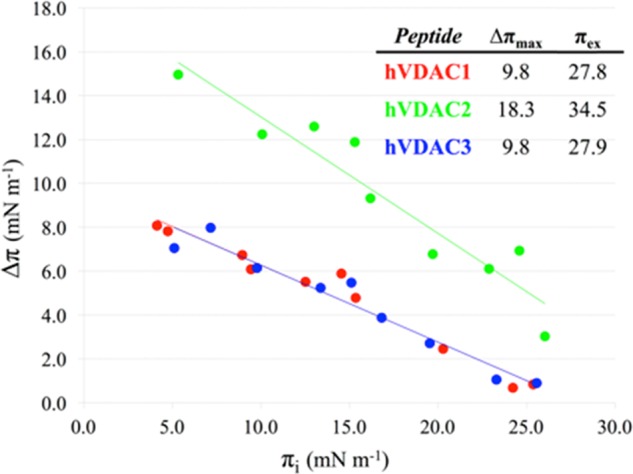
Figure 8.

Surface pressure difference (Δπ) as a function of initial surface pressures (πi) for hVDAC1(1–25) in red, hVDAC2(12–36) in green, and hVDAC3(1–25) in blue is shown. The corresponding linear curve fitting obtained by least-squares minimization is reported. In the table, the values of both Δπmax and πex are given. Monolayers were prepared with 20%mol POPG and 80%mol POPC. Peptide concentration in the subphase was 1.5 μM.
