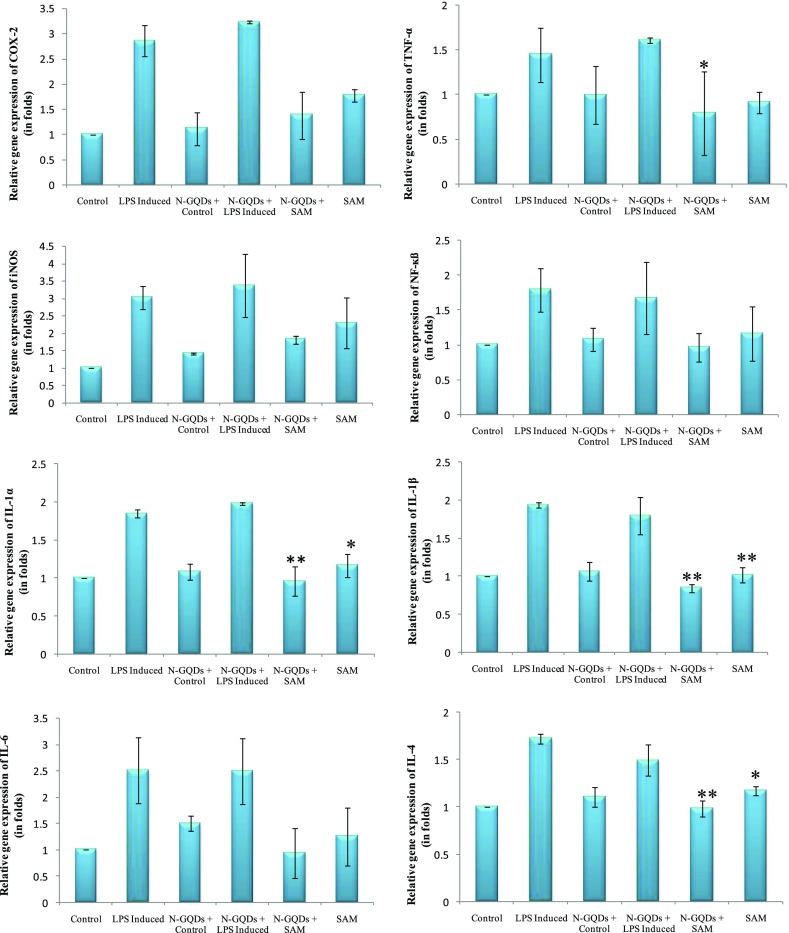
Figure 10.
Relative gene expression of COX-2, TNF-α, iNOS, NF-κβ, IL-1α, IL-1β, IL-4, and IL-6 genes in RAW 264.7 cell lines in different conditions [control (C), LPS-induced (I), normal + N-GQDs (N-GQDs + C), LPS-induced + N-GQDs (N-GQDs + LPS induced), LPS-induced + N-GQDs + SAM (N-GQDs + SAM), and LPS-induced treated with SAM (SAM)] by RT-PCR analysis (*p < 0.05; **p < 0.01).

