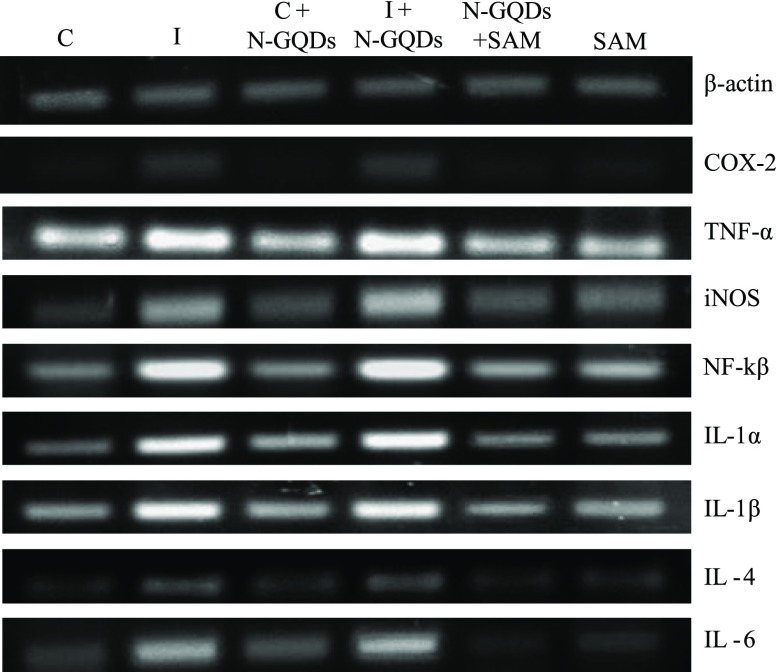
Figure 9.
Gene expression study of the inflammatory genes (COX-2, TNF-α, iNOS, NF-κß, IL-1α, IL-1ß, IL-4, and IL-6) was carried out by using semiquantitative PCR. (Control = control group; LPS-induced = LPS-induced group; C + N-GQDs = control along with N-GQDs; LPS + N-GQDs = LPS-induced treated with N-GQDs; SAM + N-GQDs = LPS-induced treated with SAM + N-GQDs and SAM = LPS induced treated with SAM alone).

