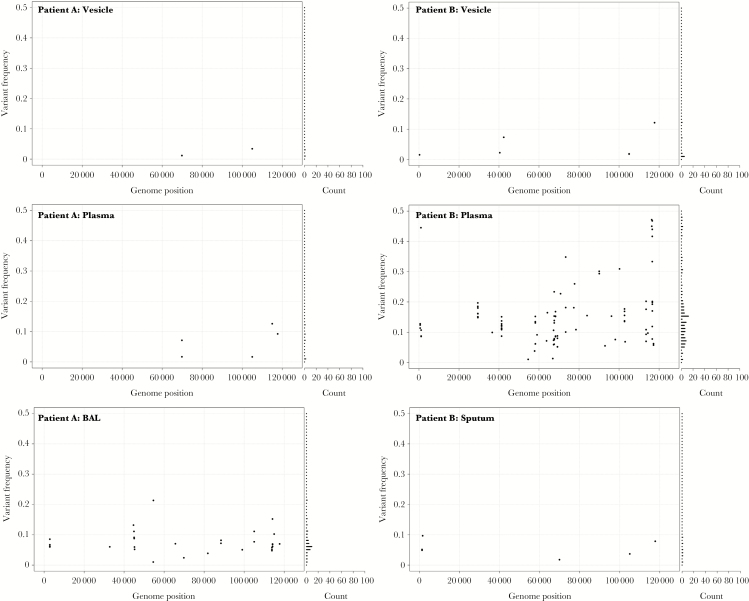
Figure 4.
The genome-wide distribution and frequency scatter plots for all variant alleles in multiple samples from patients A and B. The x axis denotes genome position and y axis denotes the frequency of each variant allele (black circle). The number of variant alleles are binned at 1% frequencies and are displayed in a horizontal bar chart on the right side. Abbreviation: BAL, bronchoalveolar lavage.

