Figure 5.
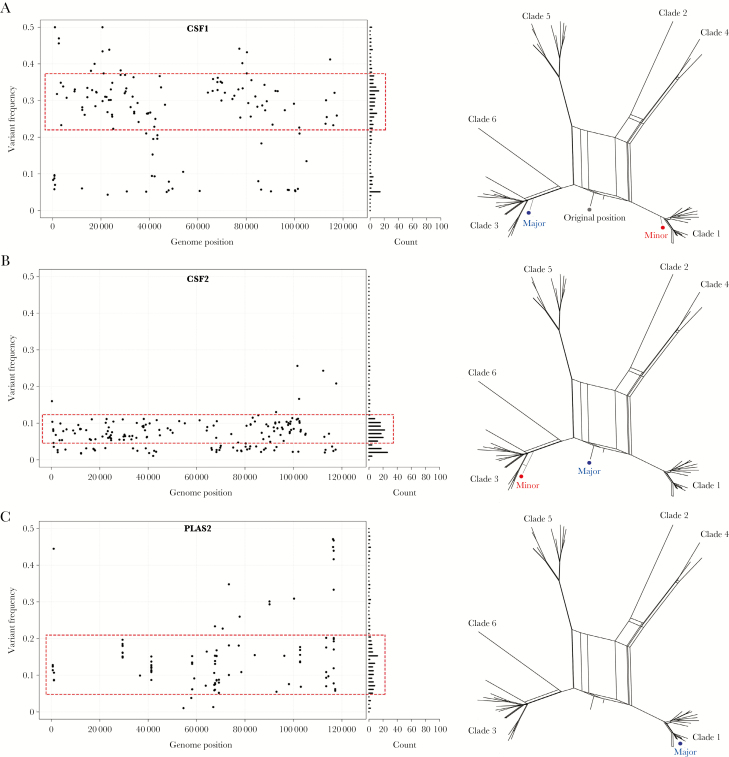
Evidence of varicella zoster virus superinfections in cerebrospinal fluid and plasma. A–C, The genome-wide distribution and frequency of all variant alleles shown as a scatter plot (left). X axis denotes genome position and y axis denotes the frequency of each variant allele (black circle). The number of variant alleles are binned at 1% frequencies and are displayed in a horizontal bar chart (right side). A normally distributed subpopulation of alleles (dotted red box) is suggestive of a mixed infection. Subpopulations are shown in the network phylogenies (right) (major sequence, blue circle; minor sequence, red circle). Abbreviations: CSF, cerebrospinal fluid; PLAS, plasma.

