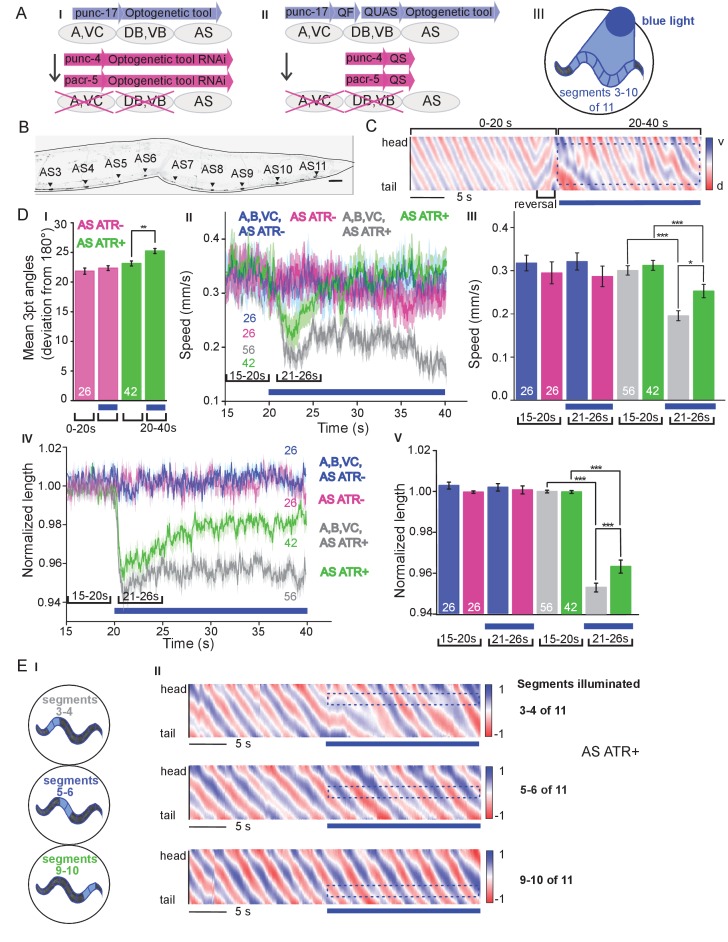
Figure 1. Specific photodepolarization of AS MNs via ChR2 leads to body contraction, increased bending angles and reduced speed in freely moving C. elegans.
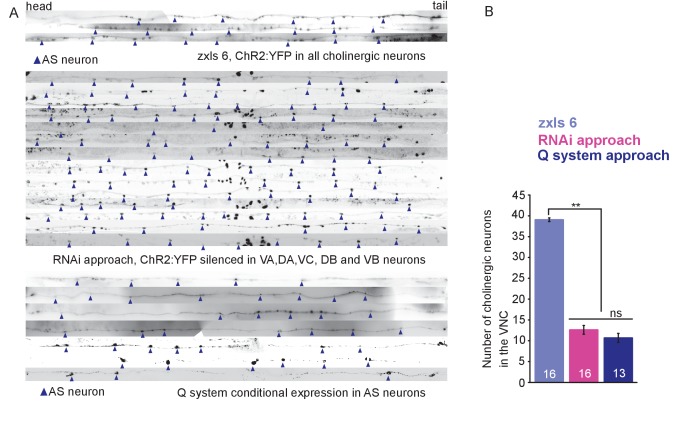
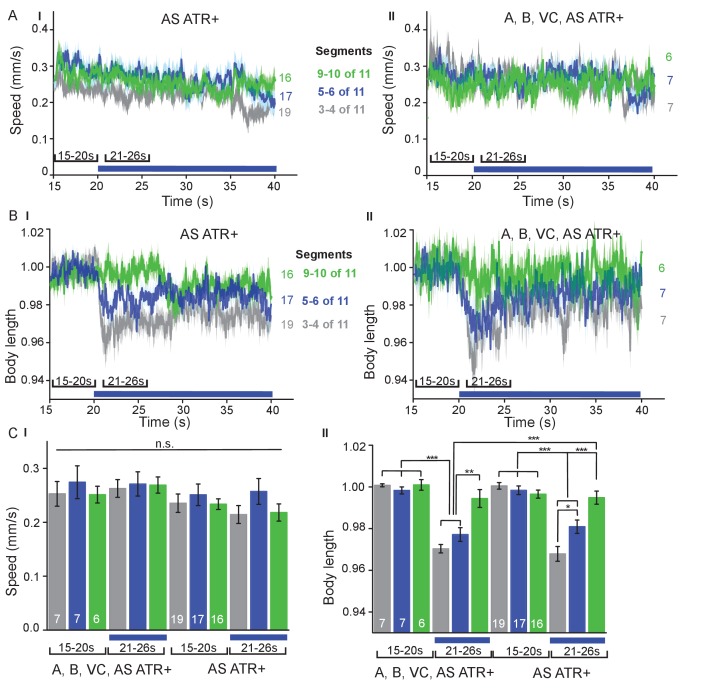
(A) ‘Subtractive’ expression and illumination strategy to achieve specific stimulation of AS MNs by optogenetic tools: (I) Silencing of optogenetic tool protein expression in the non-target subsets of MNs by dsRNA; (II) Using the Q system for conditional expression. The transcriptional activator QF binds to the QUAS sequence to induce optogenetic tool expression. The transcriptional inhibitor QS suppresses expression in unwanted cells by binding to QF; (III) Selective illumination of the VNC MNs by 470 nm blue light. The body of the worm was divided into 11 segments, of which 3 – 10 were illuminated in animals moving freely on agar plates. (B) Expression pattern of ChR2(H134R)::YFP in AS MNs by the dsRNA subtractive approach; scale bar, 20 µm. See also Figure 1—figure supplement 1. (C) Representative body postures kymograph (20 s) of normalized 2-point angles of a 100-point spine, calculated from head to tail of the animal. Positive and negative curvature is represented by blue and red color. Animal expressed ChR2 in AS MNs as in AI and was illuminated after 10 s as in AIII. Blue bar, period of 470 nm illumination. (D) Photodepolarization of AS MNs by ChR2 (in animals raised with ATR): I) Analysis of mean bending angles, before and during the blue light illumination period (as in C). (II, III) Locomotion speed: Mean ±SEM crawling speed of animals before and during blue illumination (blue bar), comparing animals expressing ChR2 in AS MNs or in all types of cholinergic MNs in the VNC, raised in the presence or absence of ATR (III: Group data of mean speed of the animals before (15–20 s) and during (21–26 s) ChR2 photoactivation); IV, (V) Mean ±SEM body length of the animals shown in I, II (V: Group data of the mean length before (15–20 s) and during (21–26 s) photoactivation). (E) Depolarization of subsets of AS MNs in body segments. (I) Scheme of anterior, midbody and posterior segmental illumination; II) Representative body posture kymographs of 2-point angles from head to tail before (20 s) and during ChR2 photoactivation by blue light in the segments of the worm body, corresponding to experiments as in E I). See also Figure 1—video 1 and Figure 1—figure supplement 2. P values *≤0.05; **≤0.01; ***≤0.001. Number of animals is indicated in D. Statistical test in D III and V: ANOVA with Tukey’s post hoc test.


