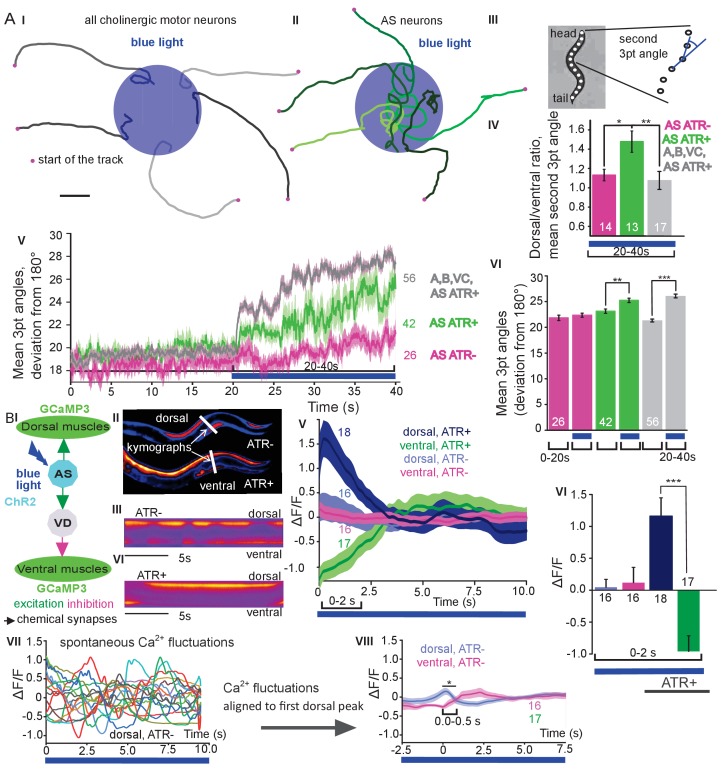
Figure 2. Photodepolarization of AS MNs causes transient activation of dorsal and simultaneous inhibition of ventral BWMs, and a dorsal bias in freely crawling animals.
A) (I, II) Representative locomotion tracks of freely moving animals (raised with ATR) with ChR2 expressed in all cholinergic MNs (I) or only in AS MNs (II) before (20 s) and during photostimulation (20 s) by 470 nm blue light (indicated by blue shaded area; tracks are aligned such that they cross the blue area at the time of light onset). (III) Schematic showing the thirteen points defining eleven 3-point angles along the spine of the animal. (IV) Mean (±SEM) ratio of dorsal to ventral bending at the 2nd 3-point bending angle in animals expressing AS::ChR2 or ChR2 in all VNC cholinergic neurons during photostimulation (animals raised with and without ATR). (V) Mean (±SEM) time traces of all 3-point bending angles (absolute values) before and during blue illumination (blue bar; ChR2 in AS MNs or in all cholinergic MNs; raised with and without ATR). (VI) Group data of experiments in (V), comparing 20 s blue light illumination (blue bar), to the 20 s before illumination. (B) I) AS MNs expressing ChR2 are illuminated by 470 nm blue light, Ca2+ signal is recorded in the BWM expressing GCaMP3 (arrows, chemical synapses). (II) Representative snapshots of Ca2+ signals in BWM cells during blue light illumination in animals cultivated with and without all-trans-retinal (ATR). Lines indicate regions used to generate kymographs. (III) Representative kymograph of spontaneous Ca2+ fluctuations in BWM cells of animal raised without ATR. (IV) Representative kymograph of Ca2+ signals in BWM cells in animals cultivated with ATR, in which AS MNs were photostimulated for the entire period. (V, VI) Mean Ca2+ signals (ΔF/F ± SEM) in dorsal and ventral BWM during the first 10 s of illumination (V) in animals raised with and without ATR and group data (VI), quantified during the first 2 s of illumination. (VII) Transients of spontaneous Ca2+ signals in dorsal muscles in animal without ATR. VIII) Mean Ca2+ signals (ΔF/F ± SEM) in dorsal and ventral BWM in animals raised without ATR, but aligned to the first dorsal Ca2+ spike, showing reciprocity of spontaneous dorso-ventral muscle activity. See also Figure 2—video 1. P values *≤0.05; **≤0.01; ***≤0.001; number of animals is indicated. Statistical test: ANOVA with Tukey’s post-hoc test.

