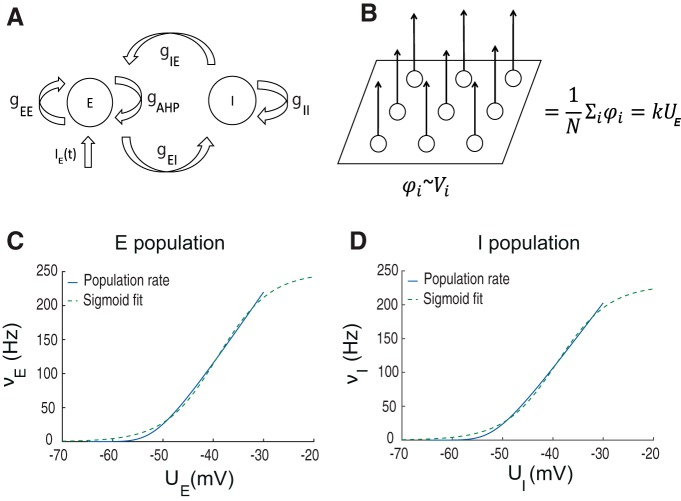
Figure 1.
Structure of the population model. A, Scheme of interacting neural populations. E, I: excitatory and inhibitory populations; , : excitatory to excitatory and excitatory to inhibitory maximal conductances; , : inhibitory-to-inhibitory and inhibitory-to-excitatory maximal conductance; gAHP: adaptation conductance in the excitatory population; : synaptic noise input to the excitatory population; AHP, afterhyperpolarization current (Buchin and Chizhov, 2010b). B, LFP model: : contribution of a single excitatory cell; N: the number of neurons; : the average membrane potential in the excitatory population. C, D, Sigmoid approximation of potential-to-rate function (Johannesma, 1968) of the excitatory (C) and inhibitory population (D).

