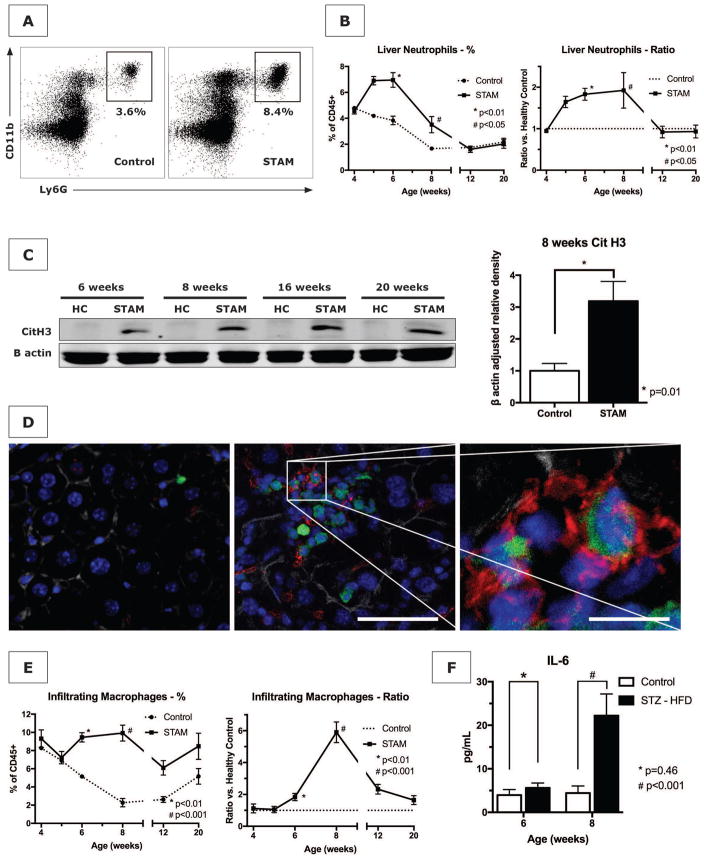
Figure 3. The STAM model of NASH results in neutrophil infiltration and NET formation prior to attraction of macrophages.
(A and B) STAM mice demonstrate an increase in infiltrating neutrophils between 5 and 12 weeks in the liver starting at 5 weeks. Because healthy control mice demonstrated a decline in hepatic neutrophils during the first 2 months of life, neutrophil count can be expressed as a ratio of STAM/control mice. (C) Western blot of livers from STAM mice have elevated levels of the NET marker citrullinated histone 3 (CitH3), compared to age-matched healthy controls (HC), which persists throughout the full course of the experiment. On quantification for age 8 weeks (n=4 in each group), CitH3 was significantly increased in STAM mice. (D) By 6 weeks of age, GFP-positive infiltrates (green) are detectable in STAM livers (middle panel, scale bar 100μm), compared to healthy control in left panel, with abundant presence of CitH3 immunofluorescent staining (red) and neutrophils with typical NET morphology (right panel, scale bar 40μm). Blue = nucleus. Grey = actin. (E) Infiltrating macrophages infiltrate the livers of STAM mice at a later time point (8 weeks) than neutrophils, concurrent with an increase in the serum level of IL-6 (F).

