

Abstract
Background
Self‐rated health (SRH) is an indicator of health status—a determinant of health‐promoting behaviors and a predictor of morbidity/mortality. Little is known about the association between SRH and ideal cardiovascular health (CVH), as measured by the AHA Life's Simple 7 (LS7) metrics, or whether the relationship between SRH and CVH differs by race/ethnicity.
Hypothesis
Favorable SRH is associated with better CVH.
Methods
We conducted a cross‐sectional analysis of 6457 men and women (4 race/ethnicities) who participated in the Multi‐Ethnic Study of Atherosclerosis. SRH was measured on a 5‐point Likert scale (excellent, very good, good, fair, and poor). CVH was assessed using the LS7 metrics, each scored from 0 to 2, with a total score of 0 to 14. Scores of 0 to 8 indicate inadequate, 9 to 10, average, and 11 to 14, optimal CVH. ORs and 95% CIs were calculated for associations between SRH and CVH scores using multinomial logistic regression, adjusted for age, sex, race/ethnicity, education, income, marital status, health insurance, and chronic diseases.
Results
Mean age of participants was 62 ± 10 years; 53% were female. Odds of ideal CVH increased as SRH improved. Compared with poor–fair SRH, adjusted ORs and 95% CIs for optimal CVH by SRH status were excellent, 4.9 (3.4–7.0); very good, 2.2 (1.6–3.1); and good, 1.5 (1.1–2.1). Results were similar by race/ethnicity, sex, and age groups.
Conclusions
More favorable SRH was associated with better CVH, irrespective of sex, race/ethnicity, or age. Further research could explore whether optimization of SRH predicts CVH.
Keywords: Ideal Cardiovascular Health Metrics, Life's Simple 7, Self‐Rated Health, Self‐Reported Health
1. INTRODUCTION
The American Heart Association (AHA) 2020 strategic impact goal is to achieve a 20% improvement in cardiovascular health (CVH) as well as a 20% reduction in mortality from cardiovascular disease (CVD) and stroke.1 The strategic impact goal marks a change in cardiovascular epidemiology from emphasis on disease (eg, CVD) to emphasis on wellness (eg, CVH).2 The AHA position statement recommends that individuals and populations meet specific criteria for 7 health metrics, collectively known as the AHA Life's Simple 7 (LS7), to be classified as having ideal CVH.1 Researchers have established an association between ideal CVH and a decrease in the risk for CVD,3, 4, 5 non‐CVD,6 and all‐cause mortality,7 in addition to lower healthcare costs,8 improvement in cognitive functioning,9 and higher quality of life.10
Epidemiological studies identify self‐rated health (SRH) as a simple, subjective measure of health status that consistently predicts morbidity and mortality in different populations even after adjusting for sociodemographic characteristics and risk factors for chronic diseases.11, 12, 13 However, the pathophysiologic mechanism responsible for the predictive value of SRH is largely unknown.11 SRH may be an indicator of clinical and subclinical disease states,11, 12, 14, 15, 16 and it may also be an indicator of individual characteristics that may influence future health outcomes.11, 12, 14, 15, 16 Additionally, SRH has been reported to be a determinant of health‐promoting behaviors and a predictor of health‐service utilization.17, 18
Although prior research has demonstrated the association between SRH and CVD morbidity and mortality,11, 19 few studies have investigated the association between SRH and CVH.20, 21, 22 Even less is known about whether the associations of SRH and CVH differ by race/ethnic groups, as there might be cultural differences in the self‐reporting of health status. Thus, the aim of our study was to examine the cross‐sectional association between SRH and ideal CVH using data from the Multi‐Ethnic Study of Atherosclerosis (MESA), a large multicenter prospective cohort study that enrolled men and women representing 4 race/ethnic groups. We hypothesized that study participants with favorable SRH will be more likely to have better CVH profiles independent of sociodemographic factors and chronic diseases, and we hypothesized that these associations would be similar across race/ethnic groups.
2. METHODS
2.1. Study population
We used baseline data from MESA for this cross‐sectional analysis. A detailed methodology of MESA has been previously described.23 Briefly, the MESA study recruited 6814 adults between July 2000 and August 2002 from 6 centers (Baltimore, MD; Chicago, IL; Forsyth County, NC; Los Angeles, CA; New York, NY; and St Paul, MN). The study included men and women aged 45 to 84 years, without a previous history of symptomatic or clinical CVD at baseline. Approximately 38% were White, 28% Black, 23% Hispanic, and 11% Chinese American. Informed consent for study participants was obtained, and the institutional review board of each recruitment center approved the study protocol. Information was obtained from participants using standardized questionnaires, physical examination, and fasting laboratory draw. This cross‐sectional analysis included 6457 participants, after the exclusion of those without complete information on SRH and the LS7 metrics (n = 357).
2.2. Study measures
2.2.1. Dependent variable: LS7 metrics
The LS7 metrics include 4 health behaviors (smoking, physical activity, body mass index [BMI] and diet) and 3 health measures (total cholesterol [TC], blood pressure [BP], and fasting blood glucose [FBG]).1 The AHA defines ideal CVH as nonsmoking, physical activity at goal levels, BMI <25 kg/m2, a healthy diet consistent with guidelines, untreated TC <200 mg/dL, untreated BP <120/<80 mm Hg, and untreated FBG <100 mg/dL.1 Smoking was assessed from self‐reports of participants and classified as current, former (quit within the last 12 months), and never smokers (never smoked or quit >12 months ago).1 In assessing physical activity, participants responded to a self‐report survey instrument adapted from the Cross‐Cultural Activity Participation Study24 containing questions on time and frequency of activities during a week in the previous month. The survey has 28 questions that were used in the estimation of the total minutes of moderate and vigorous exercise and reported in MET‐minutes per week.25 BMI was calculated using the measurements of weight and height expressed in kg/m2. For dietary assessment, a 120‐item validated food frequency questionnaire modified from the Insulin Resistance Atherosclerosis Study instrument26, 27 was utilized. The 5 components of the healthy diet comprised fruits and vegetables, fish, whole grains, and intake of sodium <1500 mg per day and sugar‐sweetened beverages ≤450 kcal (36 oz.) per week.1 Three BP measurements were obtained from each participant in a seated position after a 5‐minute rest, and the average value for the last 2 readings was recorded. TC and FBG levels were measured from blood samples taken after a 12‐hour fast.
2.2.2. Independent variable: SRH
Based on prior research,22, 28, 29, 30 SRH was assessed with a question on general health status with responses graded on a 5‐point Likert scale. Study participants were asked, “Would you say, in general, your health is”: 1, poor; 2, fair; 3, good; 4, very good; and 5, excellent. The “poor” and “fair” responses were combined as 1 (poor–fair) because of the relatively small number of responses obtained.
2.2.3. Covariates
Sociodemographic characteristics such as age, sex (men or women), race/ethnicity (White, Black, Hispanic, or Chinese American), marital status, education, income, health insurance (yes or no), and chronic diseases were the covariates included in this study. We created categorical variables for marital status (married or other [widowed, single, separated, or divorced]), education (<bachelor's degree or ≥ bachelor's degree), and income (<$40 000, or ≥$40 000). Chronic disease status was assessed from self‐reports of arthritis, asthma, blood clots, cancer, depression, emphysema, kidney disease, liver disease, and rheumatic heart disease. Chronic diseases were grouped as 0 (no chronic disease), 1 (1 chronic disease), and 2 (≥2 chronic diseases).
2.3. Statistical analysis
The characteristics of the study participants were reported by SRH categories. Categorical variables were presented as frequencies with percentages, and continuous variables were presented as mean ± SD. Descriptive statistics were used to compare the baseline characteristics of all participants by SRH categories, using ANOVA for continuous variables and χ2 tests for categorical variables. The LS7 metrics were each categorized into ideal, intermediate, and poor1 (see Supporting Information, Table 1, in the online version of this article). Points were awarded to each category with 0 indicating poor; 1, intermediate; and 2, ideal. Points were summed, yielding a total CVH score ranging from 0 to 14.31 As previously reported, CVH scores of 0 to 8, 9 to 10, and 11 to 14 were considered as inadequate, average, and optimal CVH, respectively.4, 6, 25
We reported the proportions of the LS7 metrics by SRH categories. Multinomial logistic regression modeling was used to examine the association between SRH and the composite CVH score (our primary outcome). Three separate models were fitted. Model 1 was unadjusted, model 2 was adjusted for sociodemographic factors (age, sex, race/ethnicity, education, income, marital status, and health insurance status), and model 3 was additionally adjusted for chronic diseases. Odds ratios (ORs) and their corresponding 95% confidence intervals (CIs) were calculated for average and optimal CVH score across the categories of SRH. The reference groups were the inadequate score for the CVH score and the poor–fair category for SRH. We examined the interaction of SRH with sex, race/ethnicity, and age using the likelihood ratio χ2 test, by including interaction terms in model 3. Given the interest in subgroups, we decided a priori to examine the association between SRH and CVH stratified by sex, race/ethnicity, and age (<65 and ≥65 years), regardless of whether a significant interaction was found.
We performed several supplemental analyses, as follows: First, the association between SRH with each of the individual LS7 metrics was also examined, by comparing the intermediate and ideal categories of the LS7 metrics to the poor category. Second, we examined the association of SRH with the number of LS7 metrics in the “ideal” category by calculating the ORs and 95% CIs for having 3 to 5 and 6 to 7 ideal metrics, using 0 to 2 ideal metrics as reference. This analysis was also stratified by sex, race/ethnicity, and age (<65 and ≥65 years). Finally, we used linear regression analyses to evaluate the association between SRH and the CVH score as a continuous variable. The 3 models used in the linear regression analyses were similar to those used for the logistic regression analyses. All analyses were performed using Stata software, version 14.1 (StataCorp LP, College Station, TX), and a 2‐sided P value <0.05 was considered statistically significant.
3. RESULTS
The baseline characteristics of the study participants (N = 6457) varied across SRH categories, as reported in Table 1. Fifty‐three percent of participants were female, and the mean age was 62 ± 10 years. Among study participants, 9.2% rated their health as poor–fair, 41.3% good, 33.4% very good, and 16.0% excellent. A larger proportion of men rated their health as excellent. Black and Hispanic participants had the largest proportion among those who rated their health as poor–fair, at 40% and 41.9%, respectively, whereas White participants had the largest proportion with an excellent SRH (65.7%). Participants who rated their health as poor–fair were more likely to be current smokers and less likely to be physically active or have 6 to 7 ideal LS7 metrics. They also had higher systolic BP and FBG levels.
Table 1.
Characteristics of study participants by SRH: MESA (N = 6457)
| Total, N = 6457 | Poor–Fair, n = 595 | Good, n = 2669 | Very Good, n = 2158 | Excellent, n = 1035 | P Value | |
|---|---|---|---|---|---|---|
| Mean age, y | 62.0 ± 10.2 | 63.7 ± 10.1 | 62.8 ± 10.2 | 60.9 ± 10.3 | 61.0 ± 9.8 | <0.0001 |
| Sex | ||||||
| M | 3044 (47.1) | 229 (38.5) | 1200 (45.0) | 1042 (48.3) | 573 (55.4) | <0.0001 |
| F | 3413 (52.9) | 366 (61.5) | 1469 (55.0) | 1116 (51.7) | 462 (44.6) | |
| Race/ethnicity | ||||||
| White | 2526 (39.1) | 91 (15.3) | 638 (23.9) | 1117 (51.8) | 680 (65.7) | <0.0001 |
| Chinese American | 788 (12.2) | 19 (3.2) | 521 (19.5) | 217 (10.1) | 31 (3.0) | |
| Black | 1701 (26.3) | 236 (40.0) | 763 (28.6) | 506 (23.5) | 196 (18.9) | |
| Hispanic | 1442 (22.3) | 249 (41.9) | 747 (28.0) | 318 (14.7) | 128 (12.4) | |
| Marital status | ||||||
| Married | 3947 (61.1) | 285 (47.9) | 1596 (59.8) | 1380 (64.0) | 686 (66.3) | <0.0001 |
| Othera | 2510 (38.9) | 310 (52.1) | 1073 (40.2) | 778 (36.1) | 349 (33.7) | |
| Education | ||||||
| ≥Bachelor's degree | 2317 (35.0) | 67 (11.3) | 745 (27.9) | 905 (41.9) | 600 (58.0) | <0.0001 |
| <Bachelor's degree | 4140 (64.1) | 528 (88.7) | 1924 (72.1) | 1253 (58.1) | 435 (42.0) | |
| Income | ||||||
| ≥$40 000 | 3194 (49.5) | 122 (20.5) | 1019 (38.2) | 1309 (60.7) | 744 (71.9) | <0.0001 |
| <$40 000 | 3263 (50.5) | 473 (79.5) | 1650 (61.8) | 849 (39.3) | 291 (28.1) | |
| Health insurance | ||||||
| Yes | 5884 (91.1) | 543 (91.3) | 2324 (87.1) | 2022 (93.7) | 995 (96.1) | <0.0001 |
| No | 573 (8.9) | 52 (8.7) | 345 (12.9) | 136 (6.3) | 40 (3.9) | |
| Chronic diseaseb | ||||||
| 0 | 2857 (44.3) | 134 (22.5) | 1110 (41.6) | 1034 (47.9) | 579 (55.9) | <0.0001 |
| 1 | 2456 (38.0) | 254 (42.7) | 1024 (38.4) | 827 (38.3) | 351 (33.9) | |
| ≥2 | 1144 (17.7) | 207 (34.8) | 535 (20.0) | 297 (13.8) | 105 (10.1) | |
| LS7 metrics | ||||||
| Current smoking | 832 (12.9) | 109 (18.3) | 352 (13.2) | 272 (12.6) | 99 (9.6) | <0.0001 |
| BMI, kg/m2 | 28.3 (5.5) | 30.0 (6.1) | 28.5 (5.7) | 28.2 (5.3) | 27.1 (4.6) | <0.0001 |
| Physical activity, MET‐min/week | 401.9 (606.5) | 307.9 (527.9) | 336.9 (534.9) | 426.1 (604.7) | 573.0 (767.4) | <0.0001 |
| Healthy diet score (0–5) | 1.5 (0.9) | 1.5 (0.9) | 1.6 (0.9) | 1.5 (0.9) | 1.6 (0.9) | 0.0001 |
| TC, mg/dL | 194 (35.8) | 194.2 (39.2) | 193.2 (36.6) | 195.6 (34.8) | 193.9 (33.4) | 0.5517 |
| SBP, mm Hg | 126.2 (21.4) | 131.2 (22.6) | 128.6 (22.1) | 124.4 (20.5) | 121.1 (19.1) | <0.0001 |
| DBP, mm Hg | 71.9 (10.2) | 72.8 (10.6) | 72.1 (10.4) | 71.7 (10.1) | 71.0 (10.0) | 0.056 |
| FBG, mg/dL | 97.2 (30.3) | 107.2 (43.1) | 100.8 (34.2) | 93.4 (23.7) | 90.4 (18.0) | 0.0001 |
| Baseline categories of ideal LS7 metrics | ||||||
| 0–2 | 1692 (26.2) | 262 (44.0) | 788 (29.5) | 498 (23.1) | 144 (13.9) | <0.0001 |
| 3–5 | 4496 (69.6) | 326 (54.8) | 1811 (67.9) | 1541 (71.4) | 818 (79.0) | |
| 6–7 | 269 (4.2) | 7 (1.2) | 70 (2.6) | 119 (5.5) | 73 (7.1) |
Abbreviations: BMI, body mass index; DBP, diastolic blood pressure; F, female; FBG, fasting blood glucose; LS7, Life's Simple 7; M, male; MESA, Multi‐Ethnic Study of Atherosclerosis; SBP, systolic blood pressure; SD, standard deviation; SRH, self‐rated health; TC, total cholesterol.
Data are presented as n (%) or mean ± SD. Percentages (%) were rounded up to 1 decimal place.
Other includes widowed, single, separated, or divorced.
Chronic diseases include arthritis, asthma, blood clots, cancer, depression, emphysema, kidney disease, liver disease, rheumatic heart disease.
Participants with higher SRH were more likely to have higher CVH scores (Figure 1, A). The distribution of the CVH score and the LS7 metrics by SRH are reported in Table 2. For the overall population, 20.1%, 32.6%, and 47.3% met criteria for optimal, average, and inadequate CVH scores, respectively. More than half of participants met the ideal criteria for smoking, physical activity, and FBG (85.9%, 59.8%, and 74.1%, respectively), whereas for BMI, diet, TC, and BP, less than half of participants met the ideal criteria (28.9%, 1.1%, 47.6%, and 34.6%, respectively). Among participants who self‐rated their health as excellent, the largest proportion were in the ideal category for most of the LS7 metrics, except for BMI and diet. Among participants with poor–fair SRH, >50% were in the poor category for BP. As SRH improved, the mean CVH score increased, ranging from 7.4 for poor–fair SRH to 9.5 for excellent SRH (Figure 1, B).
Figure 1.
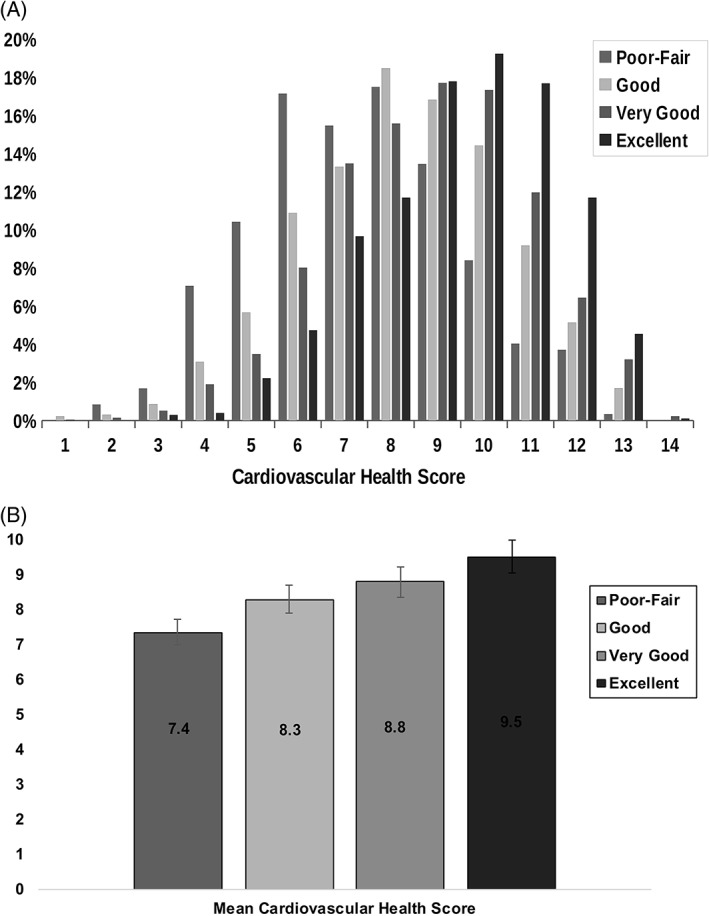
The top panel (A) shows the distribution of the CVH score measured on a continuous scale (0–14) by SRH categories. The bottom panel (B) shows the mean CVH score stratified by SRH. Bars represent SRH categories as follows: first bar, poor–fair; second bar, good; third bar, very good; and fourth bar, excellent. Abbreviations: CVH, cardiovascular health; SRH, self‐rated health
Table 2.
Distribution of LS7 Metrics by SRH
| SRH | Total, N = 6457 | Poor–Fair, n = 595 | Good, n = 2669 | Very Good, n = 2158 | Excellent, n = 1035 | P Value |
|---|---|---|---|---|---|---|
| CVH score | ||||||
| Inadequate (0–8) | 3056 (47.3) | 417 (70.1) | 1408 (52.8) | 931 (43.1) | 300 (29.0) | <0.0001 |
| Average (9–10) | 2103 (32.6) | 130 (21.9) | 834 (31.3) | 756 (35.0) | 383 (37.0) | |
| Optimal (11–14) | 1298 (20.1) | 48 (8.1) | 427 (16.0) | 471 (21.8) | 352 (34.0) | |
| LS7 metrics | ||||||
| Smoking | ||||||
| Poor | 832 (12.9) | 109 (18.3) | 352 (13.2) | 272 (12.6) | 99 (9.6) | <0.0001 |
| Intermediate | 80 (1.2) | 10 (1.7) | 35 (1.3) | 25 (1.2) | 10 (1.0) | |
| Ideal | 5545 (85.9) | 476 (80.0) | 2282 (85.5) | 1861 (86.2) | 926 (89.5) | |
| BMI | ||||||
| Poor | 2051 (31.8) | 261 (43.9) | 906 (34.0) | 661 (30.6) | 223 (21.6) | <0.0001 |
| Intermediate | 2541 (39.4) | 214 (36.0) | 1012 (37.9) | 868 (40.2) | 447 (43.2) | |
| Ideal | 1865 (28.9) | 120 (20.2) | 751 (28.1) | 629 (29.2) | 365 (35.3) | |
| Physical activity | ||||||
| Poor | 1474 (22.8) | 221 (37.1) | 707 (26.5) | 407 (18.9) | 139 (13.4) | <0.0001 |
| Intermediate | 1120 (17.4) | 96 (16.1) | 516 (19.3) | 365 (16.9) | 143 (13.8) | |
| Ideal | 3863 (59.8) | 278 (46.7) | 1446 (54.2) | 1386 (64.2) | 753 (72.8) | |
| Diet | ||||||
| Poor | 2931 (45.4) | 271 (45.6) | 1169 (43.8) | 1021 (47.3) | 470 (45.4) | 0.082 |
| Intermediate | 3456 (53.5) | 321 (54.0) | 1475 (55.3) | 1111 (51.5) | 549 (53.0) | |
| Ideal | 70 (1.1) | 3 (0.5) | 25 (0.9) | 26 (1.2) | 16 (1.6) | |
| TC | ||||||
| Poor | 863 (13.4) | 90 (15.1) | 354 (13.3) | 299 (13.9) | 120 (11.6) | 0.044 |
| Intermediate | 2523 (39.1) | 235 (39.5) | 1007 (37.7) | 883 (40.9) | 398 (38.5) | |
| Ideal | 3071 (47.6) | 270 (45.4) | 1308 (49.0) | 976 (45.2) | 517 (50.0) | |
| BP | ||||||
| Poor | 2418 (37.5) | 314 (52.8) | 1136 (42.6) | 728 (33.7) | 240 (23.2) | <0.0001 |
| Intermediate | 1805 (28.0) | 145 (24.4) | 715 (26.8) | 619 (28.7) | 326 (31.5) | |
| Ideal | 2234 (34.6) | 136 (22.9) | 818 (30.7) | 811 (37.6) | 469 (45.3) | |
| FBG | ||||||
| Poor | 694 (10.8) | 132 (22.2) | 380 (14.2) | 141 (6.5) | 41 (4.0) | <0.0001 |
| Intermediate | 978 (15.2) | 133 (22.4) | 440 (16.5) | 290 (13.4) | 115 (11.1) | |
| Ideal | 4785 (74.1) | 330 (55.5) | 1849 (69.3) | 1727 (80.0) | 879 (84.9) | |
Abbreviations: BMI, body mass index; BP, blood pressure; CVH, cardiovascular health; FBG, fasting blood glucose; LS7, Life's Simple 7; SRH, self‐rated health; TC, total cholesterol.
Data are presented as n (%). Percentages (%) are rounded up to 1 decimal place.
The associations between SRH and CVH in the total population and stratified by sex and race/ethnicity are reported in Table 3. After adjusting for sociodemographic characteristics and chronic diseases (model 3), participants who rated their health more favorably had higher odds of better CVH, compared with those who rated their health poor–fair. For example, those who self‐rated their health as good were 1.4× and 1.5× more likely to have average and optimal CVH scores, respectively, whereas those who rated their health as excellent were 2.7× and 4.9× more likely to have average and optimal CVH scores, respectively. A similarly graded association was observed in the stratified analyses by sex and race/ethnicity (Table 3). For optimal CVH scores, there was a significant interaction for SRH with sex and race/ethnicity (P < 0.001 and P = 0.011, respectively). However, the significant P values for interaction are likely driven by the fewer numbers in some subgroup categories with wide CIs noted, as qualitatively the associations appear to have a similar trend across sex and race/ethnic groups. For the average scores, the interactions were not statistically significant (P = 0.124 for sex and P = 0.976 for race/ethnicity).
Table 3.
Multivariable association between SRH and CVH by overall cohort, sex, and race/ethnicity
| CVH | ||||||
|---|---|---|---|---|---|---|
| SRH | Overall Cohort, N = 6457 | Women, n = 3422 | Men, n = 3035 | |||
|
Average vs
Inadequate |
Optimal vs Inadequate | Average vs Inadequate | Optimal vs Inadequate | Average vs Inadequate | Optimal vs Inadequate | |
| OR (95% CI) | OR (95% CI) | OR (95% CI) | ||||
| Model 1: Unadjusted | ||||||
| Poor–fair | 1 (Ref) | 1 (Ref) | 1 (Ref) | 1 (Ref) | 1 (Ref) | 1 (Ref) |
| Good | 1.9 (1.5–2.4) | 2.6 (1.9–3.6) | 2.1 (1.6–2.7) | 3.7 (2.3–6.0) | 1.7 (1.2–2.4) | 1.8 (1.1–2.7) |
| Very good | 2.6 (2.1–3.2) | 4.4 (3.2–6.0) | 2.9 (2.2–3.9) | 7.2 (4.5–11.6) | 2.3 (1.6–3.2) | 2.5 (1.6–3.8) |
| Excellent | 4.1 (3.2–5.2) | 10.2 (7.3–14.3) | 4.9 (3.4–6.9) | 21.3 (12.9–35.1) | 3.5 (2.4–5.1) | 4.9 (3.1–7.7) |
| Model 2: Adjusteda | ||||||
| Poor–fair | 1 (Ref) | 1 (Ref) | 1 (Ref) | 1 (Ref) | 1 (Ref) | 1 (Ref) |
| Good | 1.5 (1.2–1.8) | 1.6 (1.1–2.2) | 1.6 (1.2–2.1) | 2.3 (1.4–3.7) | 1.3 (0.9–1.8) | 1.0 (0.6–1.6) |
| Very good | 1.9 (1.5–2.3) | 2.3 (1.7–3.3) | 2.1 (1.5–2.8) | 3.7 (2.2–6.0) | 1.6 (1.1–2.3) | 1.3 (0.8–2.1) |
| Excellent | 2.9 (2.2–3.7) | 5.2 (3.7–7.5) | 3.4 (2.4–5.0) | 10.4 (6.1–17.8) | 2.4 (1.6–3.6) | 2.5 (1.5–4.1) |
| Model 3: Adjustedb | ||||||
| Poor–fair | 1 (Ref) | 1 (Ref) | 1 (Ref) | 1 (Ref) | 1 (Ref) | 1 (Ref) |
| Good | 1.4 (1.1–1.8) | 1.5 (1.1–2.1) | 1.6 (1.2–2.1) | 2.2 (1.3–3.5) | 1.3 (0.9–1.8) | 1.0 (0.6–1.5) |
| Very good | 1.8 (1.4–2.3) | 2.2 (1.6–3.1) | 2.0 (1.5–2.7) | 3.5 (2.1–5.7) | 1.6 (1.1–2.3) | 1.3 (0.8–2.1) |
| Excellent | 2.7 (2.1–3.6) | 4.9 (3.4–7.0) | 3.2 (2.2–4.7) | 9.5 (5.6–16.4) | 2.3 (1.6–3.5) | 2.4 (1.5–3.9) |
| White, n = 2526 | Chinese American, n = 788 | Black, n = 1701 | Hispanic, n = 1442 | |||||
|---|---|---|---|---|---|---|---|---|
| Average vs Inadequate | Optimal vs Inadequate | Average vs Inadequate | Optimal vs Inadequate | Average vs Inadequate | Optimal vs Inadequate | Average vs Inadequate | Optimal vs Inadequate | |
| SRH | OR (95% CI) | OR (95% CI) | OR (95% CI) | OR (95% CI) | ||||
| Model 1: Unadjusted | ||||||||
| Poor–fair | 1 (Ref) | 1 (Ref) | 1 (Ref) | 1 (Ref) | 1 (Ref) | 1 (Ref) | 1 (Ref) | 1 (Ref) |
| Good | 1.9 (1.2–3.2) | 2.3 (1.1–5.0) | 0.8 (0.3–2.3) | 1.1(0.3–4.0) | 1.7 (1.2–2.5) | 2.1 (1.1–4.0) | 1.3 (1.0–1.9) | 1.5 (0.9–2.5) |
| Very good | 2.4 (1.4–3.9) | 4.7 (2.2–10.1) | 0.9 (0.3–2.9) | 1.3 (0.4–4.6) | 2.7 (1.8–4.0) | 4.1 (2.1–7.7) | 1.8 (1.2–2.6) | 2.2 (1.3–3.8) |
| Excellent | 4.1 (2.4–6.8) | 12.5 (5.8–26.8) | 1.2 (0.3–5.6) | 3.0 (0.6–14.9) | 3.9 (2.5–6.2) | 8.3 (4.2–16.5) | 2.8 (1.7–4.6) | 3.5 (1.8–6.6) |
| Model 2: Adjusteda | ||||||||
| Poor–fair | 1 (Ref) | 1 (Ref) | 1 (Ref) | 1 (Ref) | 1 (Ref) | 1 (Ref) | 1 (Ref) | 1 (Ref) |
| Good | 1.8 (1.1–3.1) | 1.9 (0.9–4.1) | 0.8 (0.3–2.5) | 1.2 (0.3–4.4) | 1.6 (1.1–2.3) | 1.7 (0.9–3.3) | 1.3 (0.9–1.8) | 1.4 (0.8–2.3) |
| Very good | 2.1 (1.3–3.5) | 3.4 (1.6–7.3) | 1.0 (0.3–3.4) | 1.3 (0.3–4.7) | 2.4 (1.6–3.5) | 3.0 (1.6–5.8) | 1.4 (0.9–2.1) | 1.6 (0.9–2.8) |
| Excellent | 3.4 (2.0–5.9) | 8.1 (3.7–17.7) | 1.4 (0.3–6.5) | 2.6 (0.5–13.7) | 3.3 (2.0–5.3) | 5.7 (2.8–11.6) | 2.2 (1.3–3.7) | 2.4 (1.2–4.7) |
| Model 3: Adjustedb | ||||||||
| Poor–fair | 1 (Ref) | 1 (Ref) | 1 (Ref) | 1 (Ref) | 1 (Ref) | 1 (Ref) | 1 (Ref) | 1 (Ref) |
| Good | 1.8 (1.1–3.0) | 1.8 (0.8–4.0) | 0.8 (0.3–2.5) | 1.2 (0.3–4.2) | 1.6 (1.1–2.3) | 1.7 (0.9–3.2) | 1.2 (0.9–1.7) | 1.3 (0.8–2.2) |
| Very good | 2.0 (1.2–3.3) | 3.3 (1.5–7.1) | 1.0 (0.3–3.3) | 1.2 (0.3–4.4) | 2.3 (1.6–3.5) | 2.9 (1.5–5.6) | 1.3 (0.8–1.9) | 1.5 (0.8–2.7) |
| Excellent | 3.2 (1.9–5.6) | 7.7 (3.5–17.0) | 1.3 (0.3–6.3) | 2.5 (0.5–13.0) | 3.2 (2.0–5.2) | 5.4 (2.6–11.0) | 2.0 (1.2–3.4) | 2.2 (1.1–4.4) |
Abbreviations: CI, confidence interval; CVH, cardiovascular health; OR, odds ratio; Ref, reference; SRH, self‐rated health.
Adjusted for sociodemographic factors: age, sex, race/ethnicity, education, income, marital status, and health insurance status.
Adjusted for sociodemographic factors plus chronic diseases (arthritis, asthma, blood clots, cancer, depression, emphysema, kidney disease, liver disease, rheumatic heart disease).
The distribution of the individual LS7 metrics in the total population is reported in the Supporting Information, Table 1, in the online version of this article. The associations between SRH categories and the individual LS7 metrics in the study population are shown in Table 4. Compared with participants who rated their health as poor–fair, a more favorable SRH was mostly associated with higher odds of intermediate and ideal LS7 metrics. Supporting Information, Table 2, in the online version of this article presents the age‐stratified results (<65 years and ≥65 years) for the association between SRH and CVH and the association between SRH and number of ideal LS7 metrics; however, there were no statistically significant interactions by age. For both age categories, participants who rated their health more favorably were more likely to have average and optimal CVH scores. In addition, favorable SRH was associated with a higher number of ideal LS7 metrics regardless of sex or race/ethnicity (see Supporting Information, Table 3, in the online version of this article). In the multivariable linear regression models, a consistent graded association was found between SRH and the CVH score measured as a continuous variable, for overall and by sex, age, and race/ethnic groups (see Supporting Information, Table 4, in the online version of this article).
Table 4.
Multivariable association between SRH and the individual LS7 metrics
| CVH | ||||||||
|---|---|---|---|---|---|---|---|---|
| SRH | Smoking | BMI | Physical Activity | Diet | ||||
| Intermediate vs Poor | Ideal vs Poor | Intermediate vs Poor | Ideal vs Poor | Intermediate vs Poor | Ideal vs Poor | Intermediate vs Poor | Ideal vs Poor | |
| OR (95% CI) | OR (95% CI) | OR (95% CI) | OR (95% CI) | |||||
| Model 1: Unadjusted | ||||||||
| Poor–fair | 1 (Ref) | 1 (Ref) | 1 (Ref) | 1 (Ref) | 1 (Ref) | 1 (Ref) | 1 (Ref) | 1 (Ref) |
| Good | 1.1 (0.5–2.3) | 1.5 (1.2–1.9) | 1.4 (1.1–1.7) | 1.8 (1.4–2.3) | 1.7 (1.3–2.2) | 1.6 (1.3–2.0) | 1.1 (0.9–1.3) | 1.9 (0.6–6.4) |
| Very good | 1.0 (0.5–2.2) | 1.6 (1.2–2.0) | 1.6 (1.3–2.0) | 2.1 (1.6–2.6) | 2.1 (1.6–2.7) | 2.7 (2.2–3.3) | 0.9 (0.8–1.1) | 2.3 (0.7–7.7) |
| Excellent | 1.1 (0.4–2.8) | 2.1 (1.6–2.9) | 2.4 (1.9–3.1) | 3.6 (2.7–4.7) | 2.4 (1.7–3.3) | 4.3 (3.3–5.5) | 1.0 (0.8–1.2) | 3.1 (0.9–10.6) |
| Model 2: Adjusteda | ||||||||
| Poor–fair | 1 (Ref) | 1 (Ref) | 1 (Ref) | 1 (Ref) | 1 (Ref) | 1 (Ref) | 1 (Ref) | 1 (Ref) |
| Good | 1.0 (0.5–2.1) | 1.3 (1.0–1.6) | 1.1 (0.9–1.4) | 1.0 (0.8–1.3) | 1.5 (1.2–2.0) | 1.5 (1.2–1.8) | 0.9 (0.8–1.1) | 1.7 (0.5–5.8) |
| Very good | 0.8 (0.3–1.7) | 1.4 (1.1–1.8) | 1.4 (1.1–1.7) | 1.2 (0.9–1.6) | 1.6 (1.2–2.1) | 2.0 (1.6–2.5) | 0.9 (0.7–1.1) | 2.3 (0.7–8.1) |
| Excellent | 0.8 (0.3–2.1) | 1.9 (1.4–2.6) | 2.1 (1.6–2.7) | 2.3 (1.7–3.1) | 1.6 (1.1–2.3) | 2.7 (2.1–3.6) | 1.0 (0.8–1.3) | 3.6 (1.0–13.4) |
| Model 3: Adjustedb | ||||||||
| Poor–fair | 1 (Ref) | 1 (Ref) | 1 (Ref) | 1 (Ref) | 1 (Ref) | 1 (Ref) | 1 (Ref) | 1 (Ref) |
| Good | 0.9 (0.4–2.0) | 1.2 (1.0–1.6) | 1.1 (0.9–1.3) | 0.9 (0.7–1.2) | 1.5 (1.2–2.0) | 1.4 (1.2–1.8) | 0.9 (0.8–1.1) | 1.6 (0.5–5.6) |
| Very good | 0.7 (0.3–1.6) | 1.4 (1.0–1.8) | 1.3 (1.0–1.6) | 1.1 (0.8–1.4) | 1.6 (1.2–2.2) | 2.0 (1.6–2.5) | 0.9 (0.7–1.1) | 2.2 (0.6–7.7) |
| Excellent | 0.7 (0.3–2.0) | 1.8 (1.3–2.5) | 1.9 (1.4–2.4) | 2.0 (1.5–2.7) | 1.7 (1.2–2.4) | 2.7 (2.0–3.5) | 1.0 (0.8–1.3) | 3.4 (0.9–12.6) |
| SRH | TC | BP | FBG | |||
|---|---|---|---|---|---|---|
| Intermediate vs Poor | Ideal vs Poor | Intermediate vs Poor | Ideal vs Poor | Intermediate vs Poor | Ideal vs Poor | |
| OR (95% CI) | OR (95% CI) | OR (95% CI) | ||||
| Model 1: Unadjusted | ||||||
| Poor–fair | 1 (Ref) | 1 (Ref) | 1 (Ref) | 1 (Ref) | 1 (Ref) | 1 (Ref) |
| Good | 1.1 (0.8–1.4) | 1.2 (0.9–1.6) | 1.4 (1.1–1.7) | 1.7 (1.3–2.1) | 1.1 (0.9–1.5) | 1.9 (1.5–2.4) |
| Very good | 1.1 (0.9–1.5) | 1.1 (0.8–1.4) | 1.8 (1.5–2.3) | 2.6 (2.1–3.2) | 2.0 (1.5–2.8) | 4.9 (3.8–6.4) |
| Excellent | 1.3 (0.9–1.7) | 1.4 (1.1–2.0) | 2.9 (2.3–3.8) | 4.5 (3.5–5.8) | 2.8 (1.8–4.3) | 8.6 (5.9–12.4) |
| Model 2: Adjusteda | ||||||
| Poor–fair | 1 (Ref) | 1 (Ref) | 1 (Ref) | 1 (Ref) | 1 (Ref) | 1 (Ref) |
| Good | 1.0 (0.7–1.3) | 1.1 (0.8–1.4) | 1.2 (1.0–1.5) | 1.4 (1.1–1.8) | 1.0 (0.8–1.3) | 1.7 (1.3–2.1) |
| Very good | 1.0 (0.7–1.3) | 0.9 (0.7–1.2) | 1.5 (1.2–1.9) | 1.8 (1.4–2.4) | 1.6 (1.1–2.2) | 3.2 (2.4–4.2) |
| Excellent | 1.1 (0.7–1.5) | 1.2 (0.8–1.6) | 2.3 (1.7–3.0) | 3.2 (2.4–4.3) | 2.0 (1.3–3.2) | 5.0 (3.3–7.3) |
| Model 3: Adjustedb | ||||||
| Poor–fair | 1 (Ref) | 1 (Ref) | 1 (Ref) | 1 (Ref) | 1 (Ref) | 1 (Ref) |
| Good | 1.0 (0.8–1.4) | 1.1 (0.8–1.5) | 1.2 (1.0–1.5) | 1.3 (1.1–1.7) | 1.0 (0.8–1.4) | 1.6 (1.3–2.1) |
| Very good | 1.0 (0.8–1.4) | 1.0 (0.7–1.3) | 1.5 (1.1–1.9) | 1.8 (1.4–2.3) | 1.6 (1.2–2.3) | 3.1 (2.3–4.1) |
| Excellent | 1.2 (0.8–1.6) | 1.3 (0.9–1.9) | 2.2 (1.7–2.9) | 3.1 (2.3–4.1) | 2.1 (1.3–3.3) | 4.8 (3.2–7.1) |
Abbreviations: BMI, body mass index; BP, blood pressure; CI, confidence interval; CVH, cardiovascular health; FBG, fasting blood glucose; LS7, Life's Simple 7; OR, odds ratio; SRH, self‐rated health; TC, total cholesterol.
Adjusted for sociodemographic factors: age, sex, race/ethnicity, education, income, marital status, and health insurance status.
Adjusted for sociodemographic factors plus chronic diseases (arthritis, asthma, blood clots, cancer, depression, emphysema, kidney disease, liver disease, rheumatic heart disease).
4. DISCUSSION
4.1. Summary of findings
In this cross‐sectional analysis of adults free of CVD at baseline, we found that study participants who rated their health more favorably were more likely to have better CVH profiles as measured by average and optimal CVH scores, even after adjusting for sociodemographic factors and chronic diseases. A similarly graded relationship between favorable SRH and better CVH profiles was observed in the stratified analyses by sex, race/ethnicity, and age. Additionally, those who rated their health more favorably had higher odds of having intermediate or ideal LS7 metrics. A favorable SRH was associated with higher numbers of ideal metrics regardless of sex, race/ethnicity, or age. Our findings extend prior research by suggesting that SRH may be an indicator of CVH irrespective of sex, race/ethnicity, or age. However, neither temporality nor causation can be determined because of the cross‐sectional design of our study.
4.2. Comparison to previous studies
The findings of this study are comparable with those of other studies that have explored a similar association.20, 21, 22 However, unlike our study, most of these studies (with 1 exception20) were conducted among populations of narrow sociodemographics that limit the generalizability of their findings. In a cross‐sectional analysis of 10 687 men and women aged 45 to 64 years free of CVD in the Polish‐Norwegian Study,21 researchers demonstrated that mean number of ideal metrics and total CVH score increased with increasing SRH, measured on a scale of 1 to 10. Participants with SRH ≥7 were more likely to have ideal LS7 metrics, excluding diet and cholesterol.21 In another cross‐sectional study conducted among approximately 9000 employees of a healthcare organization, a favorable SRH was positively associated with CVH.22 For example, after adjusting for sociodemographic characteristics and chronic diseases, the odds of having average and optimal scores were >3× and >20× times higher, respectively, for participants who rated their health as excellent compared with those who rated their health as poor–fair. Additionally, for the individual LS7 metrics except for smoking, a higher SRH was associated with higher odds of having ideal and intermediate metrics.22
There was one other study that examined this question in an ethnically diverse population‐based cohort. This was a cross‐sectional analysis of 7115 US adults aged 20 to 79 years from the National Health and Nutrition Examination Survey (NHANES) of 2001–2010, which found that adults in intermediate and ideal CVH were 44% and 71% less likely to report being in fair or poor health, respectively, compared with those in poor CVH, after adjusting for sociodemographics and disability.20
4.3. Association between SRH and CVH
Our results showed that the association between SRH and CVH remained significant even after the models were adjusted for sociodemographic factors and chronic diseases, with the odds of having average and optimal CVH scores being almost 3× to 5× higher in participants who rated their health as excellent compared with those with poor–fair ratings. These findings suggest that SRH has a strong association with CVH that warrants further exploration in longitudinal studies. Although the mechanism linking SRH with CVH is not clear, prior research shows a link between positive psychosocial well‐being and increased likelihood of achieving optimal levels of the individual components of ideal CVH.32, 33, 34, 35, 36, 37, 38 This finding is supported by the results presented in this study. The converse may also be true—that individuals who are in better physical health feel better about their health status—although the associations of SRH with CVH persisted even after adjusting for other chronic health conditions.
4.4. Public‐health implications
Our study provides additional information on the association between SRH and CVH, reinforcing the possibility of using SRH as a screening tool for the assessment of CVH. We acknowledge that SRH by itself is not sufficient for the diagnosis of CVD or CVH. However, because SRH is simple, straightforward, inexpensive,12 and noninvasive, it could be an additive tool to identify people at increased risk of CVD and CV mortality19, 39 who might benefit from other preventive interventions. Self‐rated health has been described as the most inclusive and informative measure of health status40 and has been found to be a valid and reliable measurement of an individual's health.13, 16 Current guidelines encourage using SRH as a predictor of CV outcomes and to quantify patient risk, playing a complementary role to traditional risk factors as well as using it to improve the accuracy of CVD surveillance.39 The results of our study, including the consistency of findings across sex, race/ethnicity, and age groups, can help shape future study designs in this area, such as studies determining whether improving SRH can improve CVH.
4.5. Study limitations
This study has strengths. It was conducted in a large, ethnically diverse population that allowed for multiple stratified analyses, and the design excluded people with CVD at baseline. Validated instruments and standardized methods were used in the collection of data on SRH and the LS7 metrics. However, there are some limitations to be considered. First, the cross‐sectional analysis does not allow for causal inferences to be made between SRH and CVH, although our results show a strong association that should be further explored using a properly designed study, which may illuminate mechanisms between the 2 variables. Second, the study included people aged 45 to 84 years; hence, the findings may not be generalizable to people outside this age group. Third, in the stratified analyses by race/ethnicity and age presented in the Supporting Information, we did not obtain results for the “6 to 7 vs 0 to 2” category because of the small sample sizes among Chinese‐American participants and those aged ≥ 65 years. Fourth, recall bias may have been introduced with the use of self‐administered questionnaires for the collection of data on smoking, physical activity, and diet. Finally, we cannot rule out residual confounding because of the limited number of comorbidities available for adjustment in our data.
5. CONCLUSION
This study provides evidence of a strong and significant association between a favorable SRH and better CVH, irrespective of sex, race/ethnicity, or age even after accounting for other sociodemographic characteristics and chronic diseases. This study also emphasizes the usefulness of SRH as a screening tool in the population assessment of CVH. However, properly designed studies would be required to further determine the predictive value of SRH on CVH and the mechanisms underlying the relationship between the 2 variables.
Conflicts of interest
The authors declare no potential conflicts of interest.
Supporting information
Table S1. Distribution of Life's Simple 7 metrics
Table S2. Multivariable association between self‐rated health and cardiovascular health assessed by cardiovascular health score and number of ideal metrics stratified by age
Table S3. Multivariable association between self‐rated health and cardiovascular health assessed by number of ideal metrics stratified by overall cohort, sex, and race/ethnicity
Table S4. Multivariable linear regression of the association between self‐rated health and cardiovascular health by overall cohort, sex, race/ethnicity, and age
Acknowledgments
The authors thank the other investigators, the staff, and the participants of the Multi‐Ethnic Study of Atherosclerosis for their valuable contributions. A full list of participating MESA investigators and institutions can be found at http://www.mesa-nhlbi.org.
Osibogun O, Ogunmoroti O, Spatz ES, Burke GL, Michos ED. Is self‐rated health associated with ideal cardiovascular health? The Multi‐Ethnic Study of Atherosclerosis. Clin Cardiol. 2018;41:1154–1163. 10.1002/clc.22995
The Multi‐Ethnic Study of Atherosclerosis is supported by contracts N01‐HC‐95159, N01‐HC‐95160, N01‐HC‐95161, N01‐HC‐95162, N01‐HC‐95163, N01‐HC‐95164, N01‐HC‐95165, N01‐HC‐95166, N01‐HC‐95167, N01‐HC‐95168, N01‐HC‐95169, and HHSN268201500003I from the National Heart, Lung, and Blood Institute (NHLBI) and by grants UL1‐RR‐024156 and UL1‐RR‐025005 from the National Center for Research Resources (NCRR). Dr. Michos was additionally supported by the Blumenthal Scholars Fund for Preventive Cardiology at the Johns Hopkins University.
REFERENCES
- 1. Lloyd‐Jones DM, Hong Y, Labarthe D, et al; American Heart Association Strategic Planning Task Force and Statistics Committee . Defining and setting national goals for cardiovascular health promotion and disease reduction: the American Heart Association's strategic Impact Goal through 2020 and beyond. Circulation. 2010;121:586–613. [DOI] [PubMed] [Google Scholar]
- 2. Labarthe DR. From cardiovascular disease to cardiovascular health: a quiet revolution [published correction appears in Circ Cardiovasc Qual Outcomes. 2013;6:e8]? Circ Cardiovasc Qual Outcomes. 2012;5:e86–e92. [DOI] [PubMed] [Google Scholar]
- 3. Folsom AR, Yatsuya H, Nettleton JA, et al. Community prevalence of ideal cardiovascular health, by the American Heart Association definition, and relationship with cardiovascular disease incidence. J Am Coll Cardiol. 2011;57:1690–1696. [DOI] [PMC free article] [PubMed] [Google Scholar]
- 4. Ogunmoroti O, Oni E, Michos ED, et al. Life's Simple 7 and incident heart failure: the Multi‐Ethnic Study of Atherosclerosis. J Am Heart Assoc. 2017;6:e005180. [DOI] [PMC free article] [PubMed] [Google Scholar]
- 5. Yang Y, Han X, Chen Y et al. Association between modifiable lifestyle and the prevalence of atrial fibrillation in a Chinese population: based on the cardiovascular health score. Clin Cardiol. 2017;40:1061–1067. [DOI] [PMC free article] [PubMed] [Google Scholar]
- 6. Ogunmoroti O, Allen NB, Cushman M, et al. Association between Life's Simple 7 and noncardiovascular disease: the Multi‐Ethnic Study of Atherosclerosis. J Am Heart Assoc. 2016;5:e003954. [DOI] [PMC free article] [PubMed] [Google Scholar]
- 7. Ford ES, Greenlund KJ, Hong Y. Ideal cardiovascular health and mortality from all causes and diseases of the circulatory system among adults in the United States. Circulation. 2012;125:987–995. [DOI] [PMC free article] [PubMed] [Google Scholar]
- 8. Willis BL, DeFina LF, Bachmann JM, et al. Association of ideal cardiovascular health and long‐term healthcare costs. Am J Prev Med. 2015;49:678–685. [DOI] [PubMed] [Google Scholar]
- 9. Crichton GE, Elias MF, Davey A, et al. Cardiovascular health and cognitive function: the Maine‐Syracuse Longitudinal Study. PLoS One. 2014;9:e89317. [DOI] [PMC free article] [PubMed] [Google Scholar]
- 10. Bambs C, Kip KE, Dinga A, et al. Low prevalence of “ideal cardiovascular health” in a community‐based population: the Heart Strategies Concentrating on Risk Evaluation (Heart SCORE) study. Circulation. 2011;123:850–857. [DOI] [PMC free article] [PubMed] [Google Scholar]
- 11. Mavaddat N, Parker RA, Sanderson S, et al. Relationship of self‐rated health with fatal and non‐fatal outcomes in cardiovascular disease: a systematic review and meta‐analysis. PLoS One. 2014;9:e103509. [DOI] [PMC free article] [PubMed] [Google Scholar]
- 12. DeSalvo KB, Bloser N, Reynolds K, et al. Mortality prediction with a single general self‐rated health question: a meta‐analysis. J Gen Intern Med. 2006;21:267–275. [DOI] [PMC free article] [PubMed] [Google Scholar]
- 13. Idler EL, Benyamini Y. Self‐rated health and mortality: a review of 27 community studies. J Health Soc Behav. 1997;38:21–37. [PubMed] [Google Scholar]
- 14. Bailis DS, Segall A, Chipperfield JG. Two views of self‐rated general health status. Soc Sci Med. 2003;56:203–217. [DOI] [PubMed] [Google Scholar]
- 15. Jylhä M, Volpato S, Guralnik JM. Self‐rated health showed a graded association with frequently used biomarkers in a large population sample. J Clin Epidemiol. 2006;59:465–471. [DOI] [PubMed] [Google Scholar]
- 16. Kaplan G, Baron‐Epel O. What lies behind the subjective evaluation of health status? Soc Sci Med. 2003;56:1669–1676. [DOI] [PubMed] [Google Scholar]
- 17. DeSalvo KB, Jones TM, Peabody J, et al. Health care expenditure prediction with a single item, self‐rated health measure. Med Care. 2009;47:440–447. [DOI] [PubMed] [Google Scholar]
- 18. Valderas JM, Alonso J. Patient reported outcome measures: a model‐based classification system for research and clinical practice. Qual Life Res. 2008;17:1125–1135. [DOI] [PubMed] [Google Scholar]
- 19. Barger SD, Cribbet MR, Muldoon MF. Participant‐reported health status predicts cardiovascular and all‐cause mortality independent of established and nontraditional biomarkers: evidence from a representative US sample. J Am Heart Assoc. 2016;5:e003741. [DOI] [PMC free article] [PubMed] [Google Scholar]
- 20. Allen NB, Badon S, Greenlund KJ, et al. The association between cardiovascular health and health‐related quality of life and health status measures among U.S. adults: a cross‐sectional study of the National Health and Nutrition Examination Surveys, 2001–2010. Health Qual Life Outcomes. 2015;13:152. [DOI] [PMC free article] [PubMed] [Google Scholar]
- 21. Manczuk M, Vaidean G, Dehghan M, et al. Ideal cardiovascular health is associated with self‐rated health status: the Polish Norwegian Study (PONS). Int J Cardiol. 2017;230:549–555. [DOI] [PubMed] [Google Scholar]
- 22. Ogunmoroti O, Utuama OA, Salami JA, et al. Association between self‐rated health and ideal cardiovascular health: the Baptist Health South Florida Employee Study. J Public Health (Oxf). 2017;17:1–8. [DOI] [PubMed] [Google Scholar]
- 23. Bild DE, Bluemke DA, Burke GL, et al. Multi‐Ethnic Study of Atherosclerosis: objectives and design. Am J Epidemiol. 2002;156:871–881. [DOI] [PubMed] [Google Scholar]
- 24. Ainsworth BE, Irwin ML, Addy CL, et al. Moderate physical activity patterns of minority women: the Cross‐Cultural Activity Participation Study. J Womens Health Gend Based Med. 1999;8:805–813. [DOI] [PubMed] [Google Scholar]
- 25. Unger E, Diez‐Roux AV, Lloyd‐Jones DM, et al. Association of neighborhood characteristics with cardiovascular health in the Multi‐Ethnic Study of Atherosclerosis. Circ Cardiovasc Qual Outcomes. 2014;7:524–531. [DOI] [PMC free article] [PubMed] [Google Scholar]
- 26. Block G, Woods M, Potosky A, et al. Validation of a self‐administered diet history questionnaire using multiple diet records. J Clin Epidemiol. 1990;43:1327–1335. [DOI] [PubMed] [Google Scholar]
- 27. Mayer‐Davis EJ, Vitolins MZ, Carmichael SL, et al. Validity and reproducibility of a food frequency interview in a multi‐cultural epidemiologic study. Ann Epidemiol. 1999;9:314–324. [DOI] [PubMed] [Google Scholar]
- 28. Thøgersen‐Ntoumani C. An ecological model of predictors of stages of change for physical activity in Greek older adults. Scand J Med Sci Sports. 2009;19:286–296. [DOI] [PubMed] [Google Scholar]
- 29. Woolley SM, Youk AO, Bear TM, et al. Impact of coal mining on self‐rated health among Appalachian residents. J Environ Public Health. 2015;2015:501837. [DOI] [PMC free article] [PubMed] [Google Scholar]
- 30. Taylor TR, Mohammed A, Harrell JP, et al. An examination of self‐rated health among African‐American men. J Racial Ethn Health Disparities. 2017;4:425–431. [DOI] [PubMed] [Google Scholar]
- 31. Lloyd‐Jones DM. Improving the cardiovascular health of the US population. JAMA. 2012;307:1314–1316. [DOI] [PubMed] [Google Scholar]
- 32. Rahe RH, Rubin RT, Gunderson EK, et al. Psychological correlates of serum cholesterol in man: a longitudinal study. Psychosom Med. 1971;33:399–410. [DOI] [PubMed] [Google Scholar]
- 33. Räikkönen K, Matthews KA, Flory JD, et al. Effects of hostility on ambulatory blood pressure and mood during daily living in healthy adults [published correction appears in Health Psychol 1999;18:228]. Health Psychol. 1999;18:44–53. [DOI] [PubMed] [Google Scholar]
- 34. Carvajal SC, Wiatrek DE, Evans RI, et al. Psychosocial determinants of the onset and escalation of smoking: cross‐sectional and prospective findings in multiethnic middle school samples. J Adolesc Health. 2000;27:255–265. [DOI] [PubMed] [Google Scholar]
- 35. Kelloniemi H, Ek E, Laitinen J. Optimism, dietary habits, body mass index and smoking among young Finnish adults. Appetite. 2005;45:169–176. [DOI] [PubMed] [Google Scholar]
- 36. Tsenkova VK, Love GD, Singer BH, et al. Socioeconomic status and psychological well‐being predict cross‐time change in glycosylated hemoglobin in older women without diabetes. Psychosom Med. 2007;69:777–784. [DOI] [PubMed] [Google Scholar]
- 37. Boehm JK, Kubzansky LD. The heart's content: the association between positive psychological well‐being and cardiovascular health. Psychol Bull. 2012;138:655–691. [DOI] [PubMed] [Google Scholar]
- 38. Mathews L, Ogunmoroti O, Nasir K, et al. Psychological factors and their association with ideal cardiovascular health among women and men. J Womens Health (Larchmt). 2018;27:709–715. [DOI] [PMC free article] [PubMed] [Google Scholar]
- 39. Rumsfeld JS, Alexander KP, Goff DC Jr, et al. Cardiovascular health: the importance of measuring patient‐reported health status: a scientific statement from the American Heart Association. Circulation. 2013;127:2233–2249. [DOI] [PubMed] [Google Scholar]
- 40. Jylhä M. What is self‐rated health and why does it predict mortality? Towards a unified conceptual model. Soc Sci Med. 2009;69:307–316. [DOI] [PubMed] [Google Scholar]
Associated Data
This section collects any data citations, data availability statements, or supplementary materials included in this article.
Supplementary Materials
Table S1. Distribution of Life's Simple 7 metrics
Table S2. Multivariable association between self‐rated health and cardiovascular health assessed by cardiovascular health score and number of ideal metrics stratified by age
Table S3. Multivariable association between self‐rated health and cardiovascular health assessed by number of ideal metrics stratified by overall cohort, sex, and race/ethnicity
Table S4. Multivariable linear regression of the association between self‐rated health and cardiovascular health by overall cohort, sex, race/ethnicity, and age