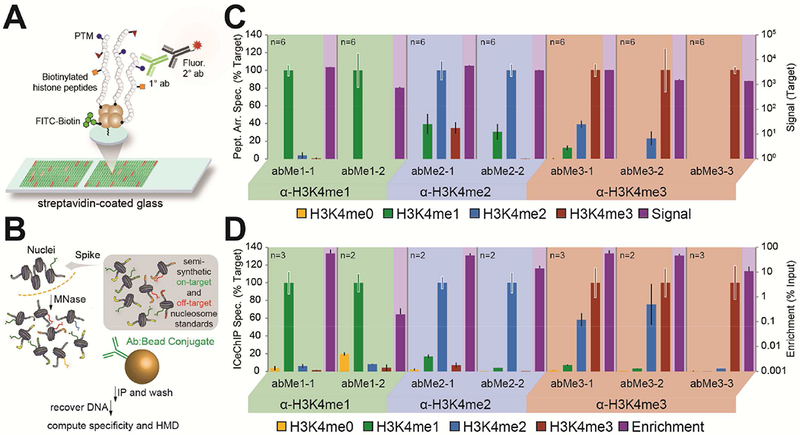
Figure 2. Histone 3 lysine 4 (H3K4) antibodies display a range of methylform specificities.

(A, B) Experimental workflows of (A) peptide arrays and (B) ICeChIP. (C, D) A representative selection of methylform binding (target relative to other forms on the left axis) by antibody from (C) peptide arrays and (D) ICeChIP is presented in bar graph form (extracted from the larger set of 52 antibodies: Figures S2 and S3). Purple bar represents raw fluorescence signal or ChIP enrichment, and maps to right axis (log10 scale). Black error bars represent SD of off-target specificity; coloured error bars represent average SD of on-target signal.
