Figure 1.
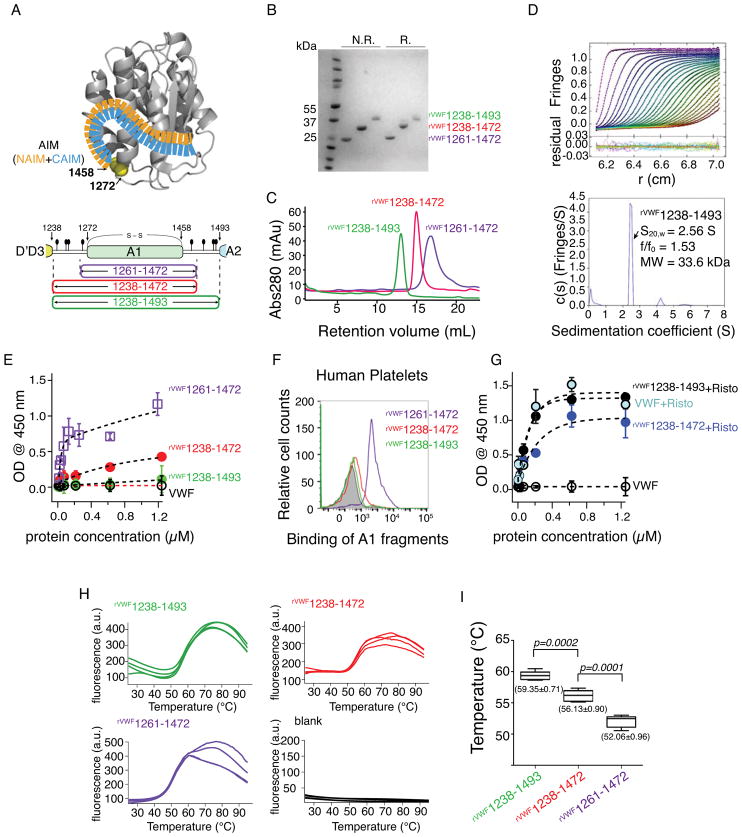
Binding and thermostability analysis of A1 fragments. (A) An AIM model from the previous study [12] and an illustration of A1 fragments. The N- and C-terminal sequences flanking the von Willebrand factor (VWF) A1 domain were designated as NAIM (orange) and CAIM (celestial blue). The starting and ending residue numbers of each fragment are labeled. O-glycosylation sites (filled ovals) and the 1272-1458 disulfide bond are marked. (B) A Coomassie blue-stained polyacrylamide gel showing the purified proteins under non-reducing (N.R.) and reducing (R.) conditions. (C) Superimposed gel filtration chromatograms of A1 fragment from Superdex 200 10/300 GL SEC column. (D) Sedimentation velocity results for rVWF1238- 1493 showing the fitted interference scans and residuals (upper) and sedimentation coefficient distributions (lower). Every second scan and every third data point are shown for clarity. (E, G) ELISA measurements (n = 3) of the isotherms of A1 fragments and human plasma-derived VWF binding to immobilized GPIb-IX in the absence (E) and presence (G) of 1.5 mg/mL ristocetin. (F) Representative histogram of flow cytometry measurement to determine the binding of A1 fragments to platelets in platelet rich plasma. (H) SYPRO Orange fluorescence intensity changes over the temperature of each A1 fragment (n=4). Temperature increment is 1°C per minute. (a.u., arbitrary unit) (I) Whisker plot of the melting temperature measurements from (H). Mean value ± standard deviations are marked under each plot. A paired t-test was conducted using GraphPad Prism 5 (GraphPad Software, Inc. CA the USA) and the p-value was marked.

