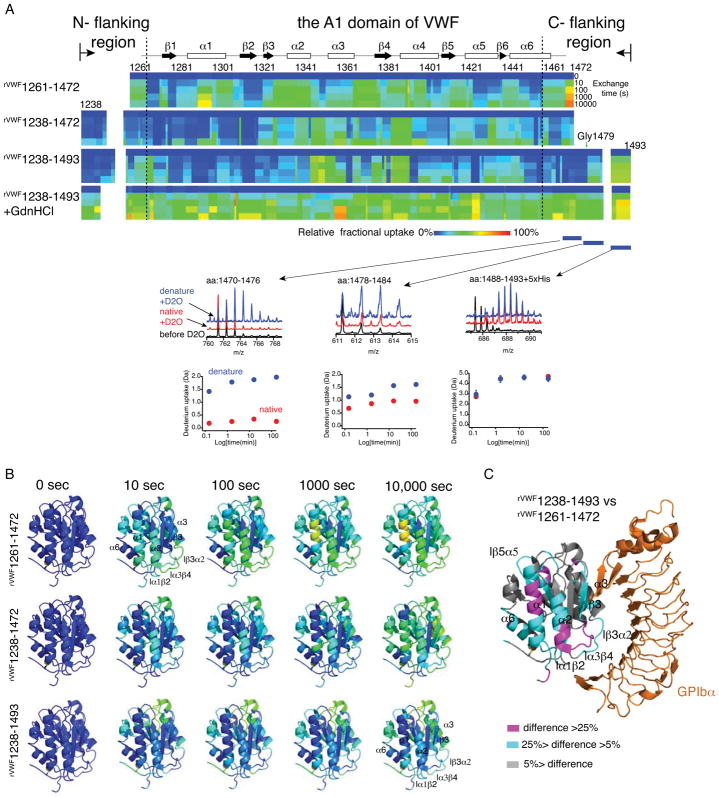
Figure 2.
Hydrogen-deuterium exchange (HDX) characterization of A1 fragments. (A) Residual HDX heat map of each A1 fragments from 10 s to 10 000 s. The line for 0 s denoted the results obtained without exchange. Relative fractional deuterium uptake was plotted using the rainbow color scale. Secondary structures of each region were labeled on top. Denaturation of rVWF1238-1493 (rVWF1238-1493 +GdnHCl) was performed as described [9]. Three representative peptides around Gly1479 were selected to show their raw mass spectra and deuterium uptake in the native (red) and denatured (blue) forms. (B) 3D projection of HDX data at the indicated exchange time. HDX data were mapped to the structure of the A1 domain (Protein Data Bank, 1SQ0, only residues 1269-1466 were shown in the structure) using PyMOL. (C) 3D projection of the difference in relative fractional uptake at 10 000 s of exchange between rVWF1238-1493 and rVWF1238-1472, as defined by the color code in the figure.

