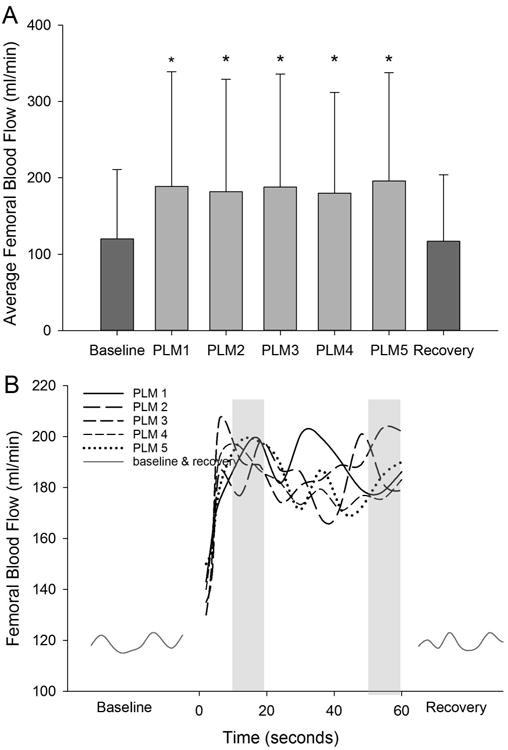
Figure 1.

Average femoral blood flow values across the 5 bouts of PLM. * Denotes a significant increase (p<0.05) from baseline and recovery (A). There was no difference in average blood flow between the 5 bouts of PLM. Data presented as mean±SD. Line graphs illustrating the kinetics of femoral blood flow for each bout of PLM, (B). T-tests revealed no significant differences in average blood flow between 12-24 and 48-60 seconds (represented by grey column) within each bout of PLM.
