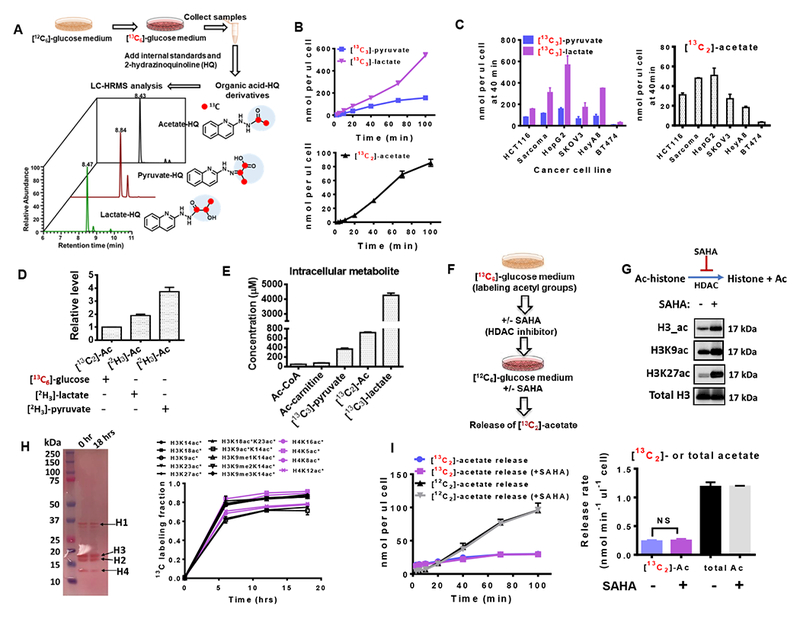
Figure 1. Acetate is synthesized from glucose independent of acetyl-CoA related reactions.

(A) Scheme of experimental setup for measuring glucose-derived acetate, pyruvate and lactate. (B) Medium concentration of [13C3]-pyruvate, [13C2]-acetate, and [13C3]-lactate secreted from HCT116 cells cultured in RPMI 1640 medium containing [13C6]-glucose. Time 0 is when medium was switched to [13C6]-glucose medium. (C) The amount of [13C2]-pyruvate, [13C3]-lactate and [13C2]-acetate released from various cultured cells at time 40 min after switching to [13C6]-glucose medium. (D) The relative levels of acetate production in HCT116 cells cultured in glucose free medium containing different tracers: [13C6]-glucose (11.1 mM), [2C3]-lactate (5 mM) or [2C3]-pyruvate (5 mM). (E) Intracellular concentrations of metabolites in HCT116 cells after incubation in [13C6]-glucose medium for 5 hrs. (F) Schematic depicting the workflow for HCT116 cells with [13C6]-glucose and or treatment with the histone deacetylation inhibitor, SAHA. (G) Western blots of histone acetylation sites from HCT116 cells in the absence or presence of SAHA (5 μM) for 1 hr. (H) Ponceau s staining (left panel) and quantitative proteomic analysis (right panel) of histone extracts from HCT116 cells cultured in the presence of 13C-glucose for 0, 6, 12 and 18 hrs. * denotes 13C labeled acetyl groups on histones. (I) Release of acetate from HCT116 cells with 6 hours pretreatment of [13C6]-glucose in the presence or absence of histone deacetylation inhibitor (SAHA, 5 μM) for 1 hr (left panel). The release rate (right panel) is obtained by calculating the slope of the acetate release curve. Abbreviations: Ac, Acetate; Ac-histone, acetylated histone. The acetylated histone sites include lysine 14 (H3K14ac), lysine 18 (H3K18ac), lysine 18 and lysine 23 (H3K18acK23ac), lysine 23 (H3K23ac), lysine 27 (H3K27ac), lysine 9 (H3K9ac), lysine 9 and lysine 14 (H3K9acK14ac), lysine 14 containing mono-methylation at lysine 9 (H3K9me1K14ac), lysine 14 containing di-methylation at lysine 9 (H3K9me2K14ac), lysine 14 containing tri-methylation at lysine 9 (H3K9me3K14ac) of histone H3, and acetylation on lysine 16 (H4Kac), lysine 5 (H4K5ac), lysine 8 (H4K8ac), and lysine 12 (H4K12ac). Values are expressed as mean ± SD of n=3 independent measurements. NS: p>0.05 in Student’s t test. See also Figure S1.
