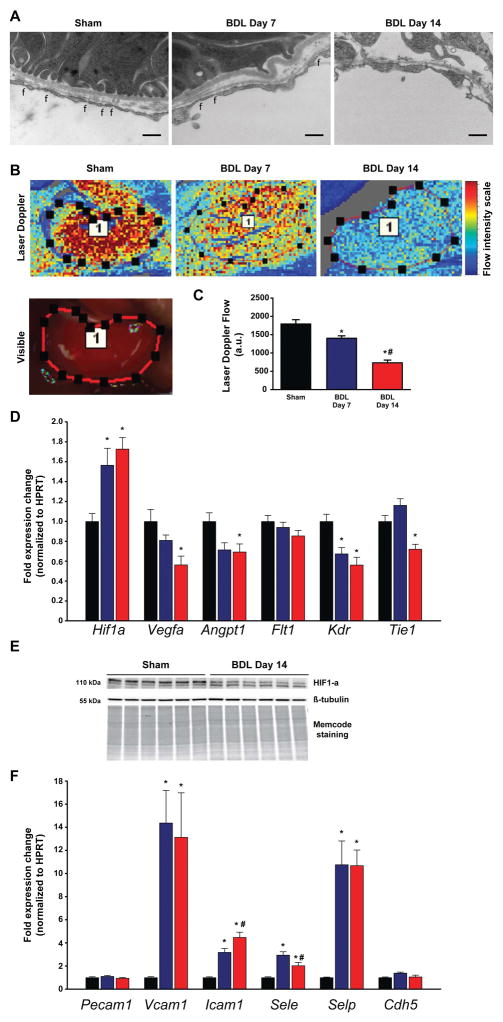
Fig. 3. Impaired renal microcirculation, and vascular inflammation leads to tubular hypoxia.
(A) Transmission electron microscopic images of peritubular endothelial cells. Original magnification is 25,000X, scale bar represents 400 nm, f: fenestrations. (B) Representative illustration of renal microcirculation by Laser speckle contrast analysis. (C) Quantification of renal microvascular flow. (D) Gene expression of hypoxia-inducible factor 1-alpha(Hif1a), vascular endothelial growth factor A(Vegfa), angiopoietin 1(Angpt1), vascular endothelial growth factor receptor 1(Flt1), vascular endothelial growth factor receptor 2(Kdr), and tyrosine kinase with immunoglobulin-like and EGF-like domains 1(Tie1). (E) Hypoxia-inducible factor 1-alpha(HIF1α) protein expression analysis by Western blot. (F) Expression of vascular adhesion molecules platelet endothelial cell adhesion molecule 1(Pecam1), vascular cell adhesion molecule 1(Vcam1), intercellular adhesion molecule 1(Icam1), E-selectin(Sele), P-selectin(Selp), and VE-cadherin(Cdh5) in sham operated mice (Sham) or in mice subjected toBDL and sacrificed on postoperative day 7 (BDL Day 7) or day 14 (BDL Day 14), respectively. Results are mean±S.E.M. *p<0.05 vs. sham #p<0.05 vs. BDL Day 7, n=6.

