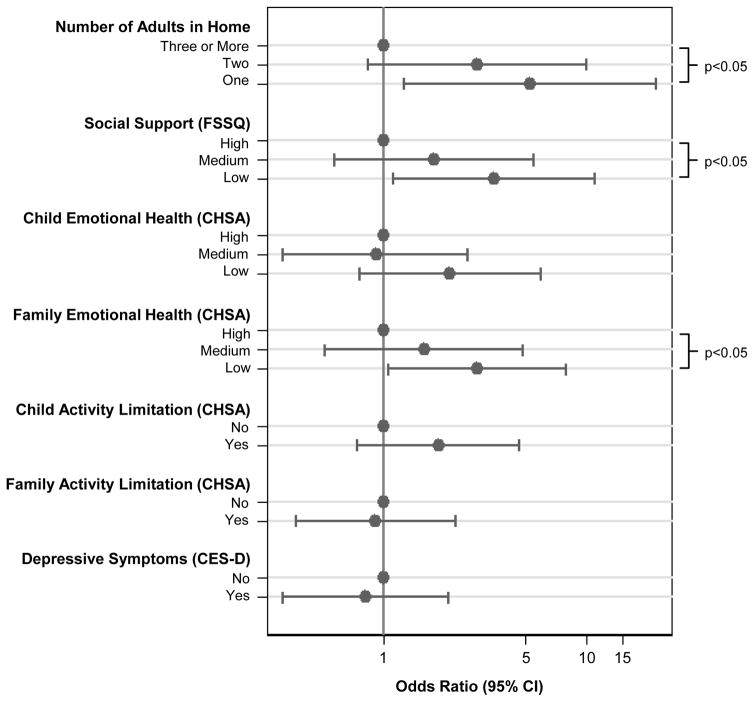
FIGURE 2.
Association of each factor with odds of the SHS-exposed household having no residential smokers. Scales are divided into tertiles or dichotomized. With respect to child emotional health, the highest tertile represents 34% of participants with a score of 100 (the scale maximum). With respect to child and family activity limitation, “No” indicates a score of 100 (the scale maximum). P-values indicate a test for linear trend across tertiles. The base model controlled for participant age, gender, race, insurance status, sibling status; caregiver age, relationship to participant, education level, unemployment status; and number of adults in the home. Psychosocial scale estimates are from separate models that include that scale in addition to base model predictors. CHSA = Children’s Health Survey for Asthma. FSSQ = Duke-UNC Functional Social Support Scale. CES-D = Center for Epidemiological Studies Depression Scale.

