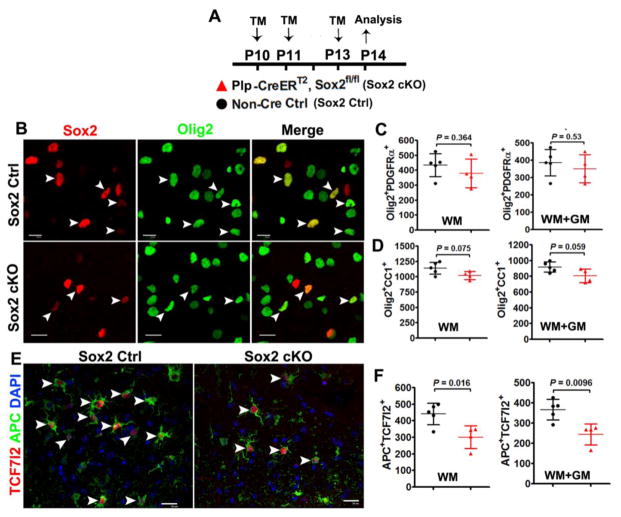
Figure 10. Sox2 regulates the rate of oligodendrocyte production – evidences from Plp-CreERT2:Sox2fl/fl transgenic mice.
A, transgenic mice and experimental designs for Panels B–F. Plp-CreERT2:Sox2fl/fl (Sox2 cKO) and non-Cre Ctrl mice were injected intraperitoneally with tamoxifen at P10, P11 and P13 once a day, and sacrificed 24 h after the last injection. B, representative confocal images showing Sox2 is expressed in Olig2+ oligodendroglial lineage cells in non-Cre Ctrl (upper panels, arrowheads) and absent from most Olig2+ cells in P14 spinal cord of Sox2 cKO mice (lower panels, arrowheads). Scale bars = 10 μm. C, densities (per mm2) of Olig2+PDGFRα+ OPCs. Two-tailed Student’s t test [t(7) = 0.972 WM, t(7) = 0.661 WM+GM]. D, densities (mm2) of Olig2+CC1+ OPCs. Two-tailed Student’s t test [t(7) = 2.088 WM, t(7) = 2.258 WM+GM]. E, representative confocal images showing reduction of APC+TCF7l2+ premyelinating OLs in P14 spinal cord. Scar bars = 10 μm. F, density (per mm2) of APC+TCF7l2+ cells. Two-tailed Student’s t test [t(7) = 3.163 WM, t(7) = 3.528 WM+GM].

