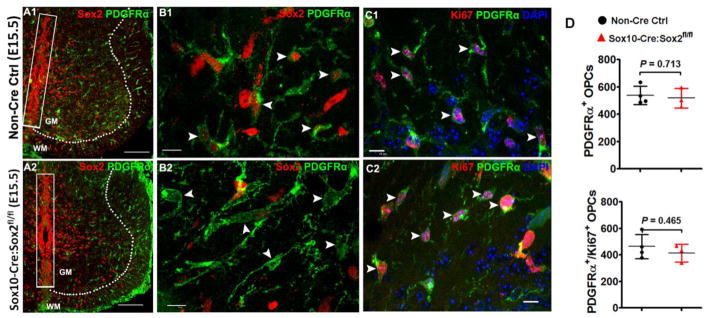
Figure 2. Sox2 ablation does not affect OPC migration and proliferation during embryonic spinal cord development.
A1–A2, low magnification confocal images showing that Sox2-deficient PDGFRα+ embryonic OPCs are generated and migrate normally into the primitive gray and white matter (A2) in a similar manner to those in Sox2-intact OPCs (A1). Dashed lines demarcate gray matter (GM) and white matter (WM). Note that Sox2 is preserved in the neuroepithelial cells (boxed areas) aligning the ventricular zones in E15.5 Sox10-Cre, Sox2fl/fl (Sox2 cKO) spinal cord. B1–B2: high magnification confocal images showing similar distribution and equivalent density of PDGFRα+ embryonic OPCs in the whiter matter of E15.5 spinal cord of Sox2 cKO (B2, arrowheads) and non-Cre control (B1, arrowheads). C1–C2, the distribution and density of Ki67+PDGFRα+ proliferating OPCs are similar in Sox2 cKO (C2, arrowheads) spinal cord to those in non-Cre controls (C1, arrowheads) at E15.5. Blue in C1–C2 is DAPI nuclear staining. D, densities of OPCs and proliferating OPCs in the primitive WM of spinal cord at E15.5. Two tailed Student’s t test, t(5) = 0.3897 PDGFRα+, t(5) = 0.7903 PDGFRα+Ki67+. Scale bar: A1, A2, 100 μm; B1–C2, 10 μm.

