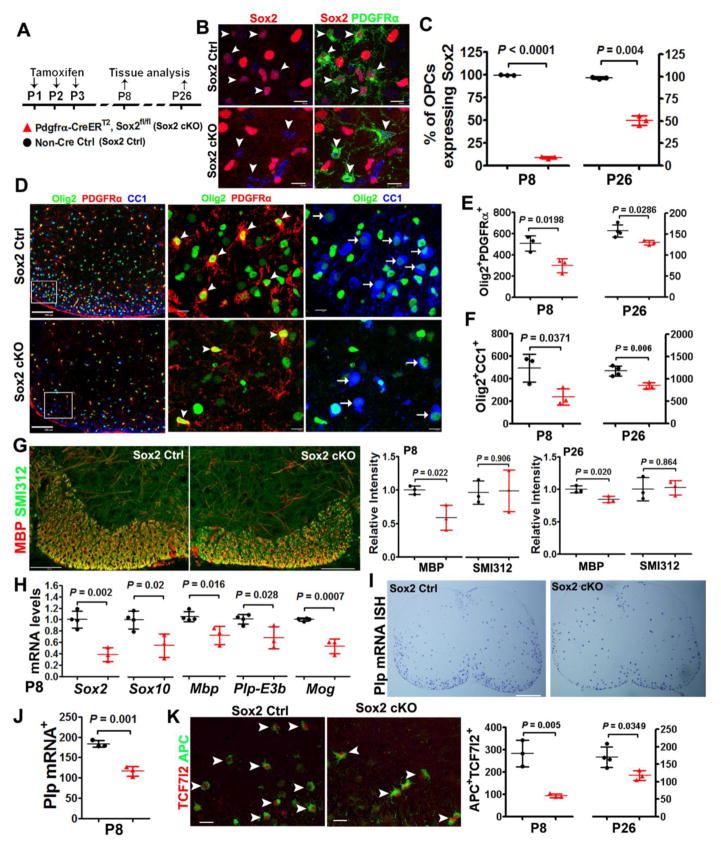
Figure 6. Sox2 regulates OPC population supply and impacts OL differentiation in the murine postnatal spinal cord.
A, transgenic mice and experimental designs. Pdgfrα-CreERT2, Sox2fl/fl (Sox2 cKO) neonates and non-Cre controls were injected subcutaneously with tamoxifen at P1, P2 and P3 once a day and spinal cords were analyzed on P8 and P26. B, representative confocal images showing Sox2 is expressed in PDGFRα+ OPCs in non-Cre Ctrl (upper panels, arrowheads) and absent from PDGFRα+ OPCs in Sox2 cKO (lower panels, arrowheads) spinal cord at P8. Scale bars = 10 μm. C, percentage of PDGFRα+ OPCs that express Sox2 in the spinal white matter at P8 and P26. Two-tailed Student’s t test [t(4) = 116.2 P8, t(4) = 15.25 P26]. D, triple immunohistochemistry of pan-oligodendroglial lineage marker Olig2, OPC marker PDGFRα and OL marker CC1 in Sox2 Ctrl and cKO spinal cord at P8. Boxed areas in the first column are shown at higher magnification at the right. Arrowheads and arrows point to examples of Olig2+PDGFRα+ OPCs and Olig2+CC1+ OLs, respectively. Scale bars, 100 μm in the first column images, 10 μm in the rest images. E, quantification (per mm2) of Olig2+PDGFRα+ OPCs in spinal cord WM. Two-tailed Student’s t test [t(4) = 3.758 P8, t(5) = 3.044 P26]. F, density (per mm2) of Olig2+CC1+ OLs in the spinal cord WM. Two-tailed Student’s t test [t(4) = 3.077 P8, t(5) = 4.568 P26]. G, representative confocal images of MBP and axonal marker SMI312 (scale bars = 100 μm) in the ventral medial white matter of spinal cord (left) and quantification of MBP and SMI312 relative intensity (right) at P8 and P26. Two-tailed Student’s t test, t(4) = 3.644 MBP and t(4) = 0.126 SMI312 at P8; t(4) = 3.699 MBP and t(4) = 0.183 SMI312 at P26. H–I, representative bright-field images of Plp mRNA in situ hybridization (ISH) of spinal cord and quantification at P8. Two-tailed Student’s t test, t(4) = 7.941. Scale bars = 200 μm. J, RT-qPCR quantification of spinal cord mRNA levels of indicated genes at P8. The mRNA level was normalized to the internal control Hsp90, and the level in Sox2 Ctrl was set to 1. Two-tailed Student’s t test [t(5) = 5.880 Sox2, t(5) = 3.346 Sox10, t(5) = 3.552 Mbp, t(5) = 3.072 Plp-E3b, t(5) = 7.408 Mog]. K, representative confocal images of APC and TCF7l2 in the P8 spinal cord (left) and quantification (right). Scale bars = 20 μm. Two-tailed Student’s t test, t(4) = 5.526 P8, t(5) = 2.833 P26.

