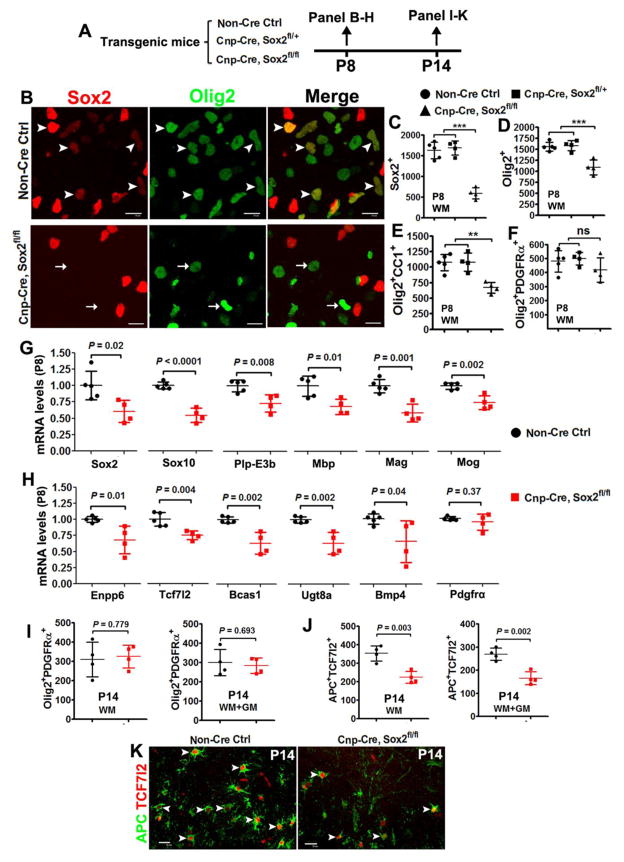
Figure 8. Sox2 positively regulates the timing of OL differentiation in the postnatal mouse spinal cord.
A, transgenic mice and experimental designs. B, representative confocal images of Sox2 and pan-oligodendroglial marker Olig2 in the white matter of P8 spinal cord. Scale bars = 10 μm. Note that Sox2 is expressed in Olig2+ cells in non-Cre Ctrl (upper panels, arrowheads) and absent from most Olig2+ cells in Cnp-Cre, Sox2fl/fl mice (arrows in the lower panels). C–F, quantification of marker-positive cells in the white matter of P8 spinal cord of non-Cre Ctrl, Cnp-Cre, Sox2fl/+ (one-allele KO), and Cnp-Cre, Sox2fl/fl (Sox2 cKO) mice. One-way ANOVA, F(2,10) = 52.18 P < 0.0001 Sox2+, F(2,10) = 19.16 P = 0.0004 Olig2+, F(2,10) = 1.429 P = 0.285 Olig2+PDGFRα+, F(2,10) = 14.80 P = 0.001 Olig2+CC1+. Tukey post hoc test was used for pairwise comparisons, ** P < 0.001, *** P < 0.0001, ns, not significant. G–H, RT-qPCR quantification of mRNA expression of indicated genes in P8 spinal cord. mRNA level was normalized to the internal control Hsp90, and the level in Sox2 Ctrl was set to 1. Two-tailed Student’s t test [t(7) = 2.957 Sox2, t(7) = 8.307 Sox10, t(7) = 3.660 Plp-E3b, t(7) = 3.386 Mbp, t(7) = 5.252 Mag, t(7) = 4.782 Mog, t(7) = 3.331 Enpp6, t(7) = 4.129 Tcf7l2, t(7) = 4.688 Bcas1, t(7) = 3.950 Ugt8a, t(7) = 2.383 Bmp4, t(7) = 0.950 Pdgfrα]. I, densities (per mm2) of Olig2+PDGFRα+ OPCs in the WM and whole spinal cord (WM+GM) at P14. Two-tailed Student’s t test [t(6) = 0.293 WM, t(6) = 0.415 WM+GM]. J–K, quantification and representative confocal images showing substantial reduction of APC+TCF7l2+ premyelinating OLs in Cnp-Cre, Sox2fl/fl spinal cord at P14. Scale bars = 10 μm. Two-tailed Student’s t test [t(6) = 4.935 WM, t(6) = 5.448 WM+GM]. Arrowheads point to APC+TCF7l2+ premyelinating OLs.

