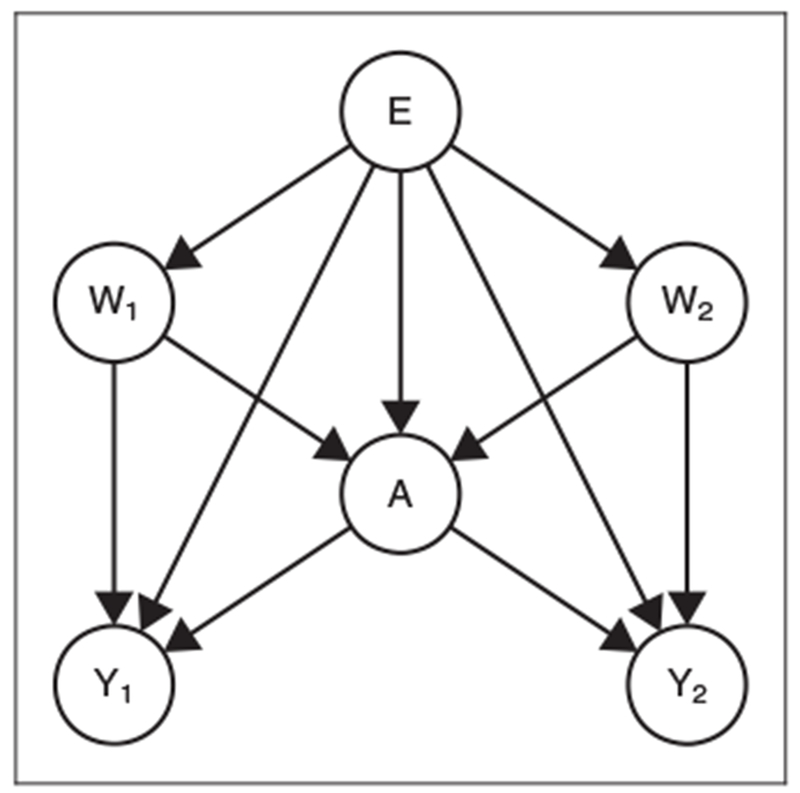
Figure 2.

Simplified directed acyclic graph for the restricted hierarchical causal model (equation (11)). For ease of presentation, we only show two individuals, denoted by subscripts 1 and 2, in a given cluster and assume all unmeasured factors U are independent. For additional details, see Supplementary Figure S2.
