
Fig. 1.
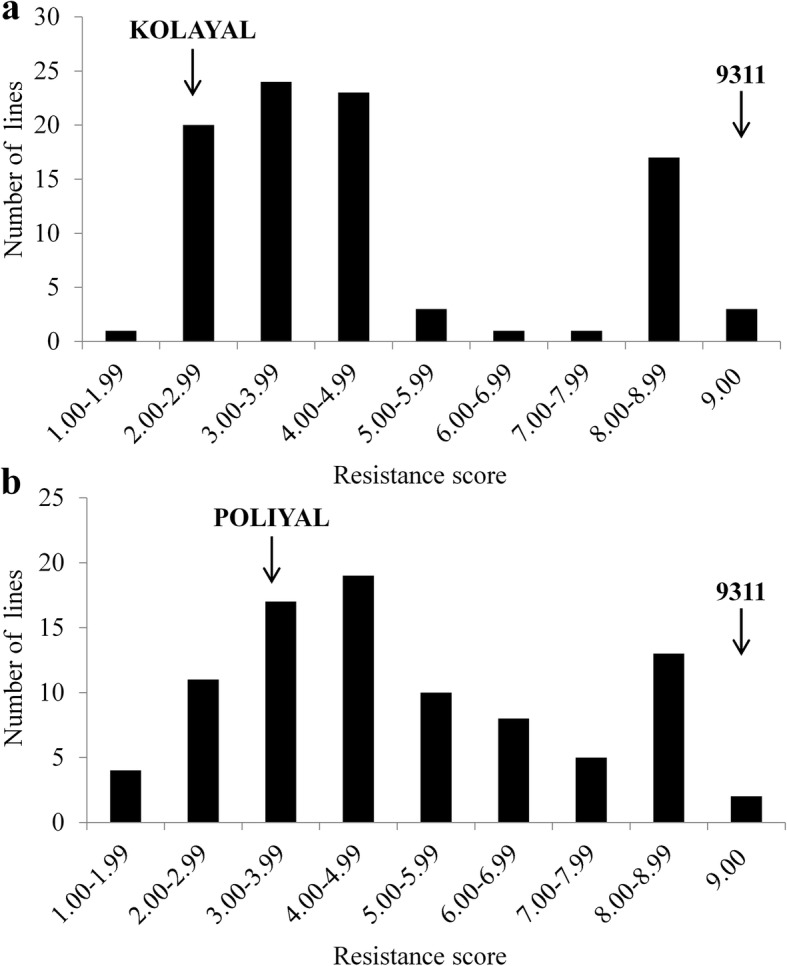
Frequency distribution of BPH resistance score in two F2:3 populations. a Population from 9311 × KOLAYAL; b Population from 9311 × POLIYAL. The resistance scores of individuals were measured at the time of 12 days after infestation (DAI)
Official websites use .gov
A
.gov website belongs to an official
government organization in the United States.
Secure .gov websites use HTTPS
A lock (
) or https:// means you've safely
connected to the .gov website. Share sensitive
information only on official, secure websites.
Frequency distribution of BPH resistance score in two F2:3 populations. a Population from 9311 × KOLAYAL; b Population from 9311 × POLIYAL. The resistance scores of individuals were measured at the time of 12 days after infestation (DAI)