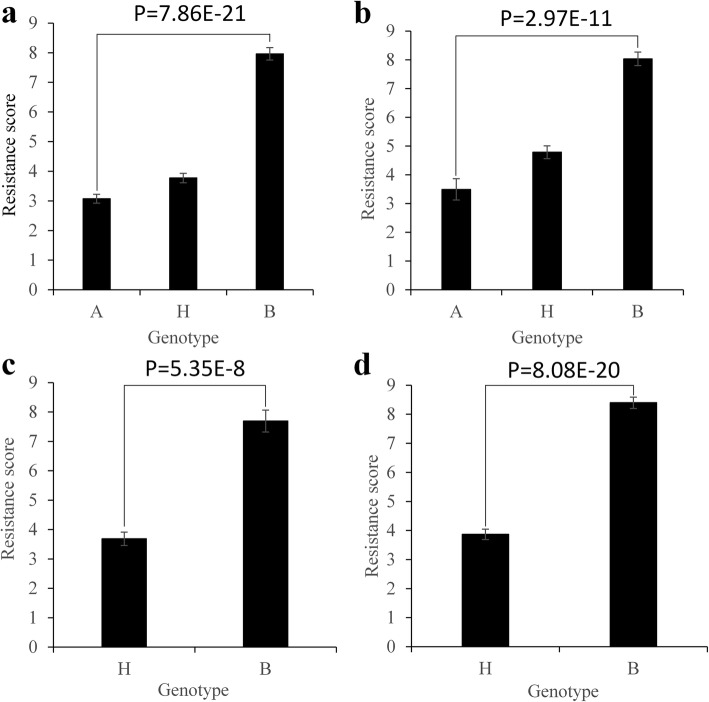
Fig. 3.
Comparison of resistance levels among different Bph33 genotypes in four populations. a and b In the BC1F2:3 populations from 9311 × KOLAYLA (a) and 9311 × POLIYAL (b); c and d In the BC2F1 populations from 9311 × KOLAYLA (c) and 9311 × POLIYAL (d). The Bph33 genotype was identified according to its flanking markers H25 and D17. A, KOLAYLA or POLIYAL genotype; B, 9311 genotype; H, heterozygote genotype. P-values are shown for the comparison between A and B (in a and b) or between B and H (in c and d)

