Fig. 1.
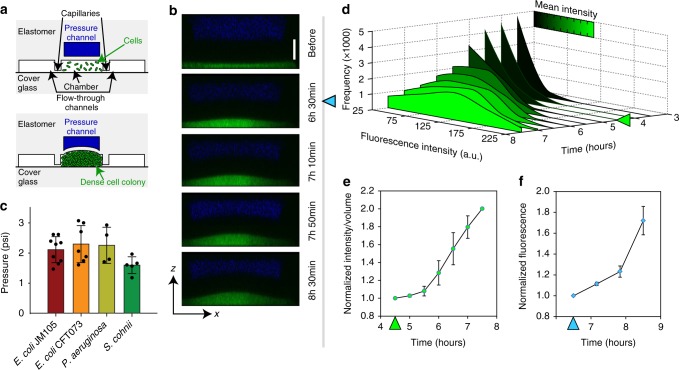
Pressure buildup as a result of confined growth leads to biochemical stress response. a Schematic cross-section of the microfluidic device, illustrating the deformation of the flexible roof due to bacterial colony growth. b The deformation of the roof [black area between blue (Alexa Fluor 647) and green (GFP-expressing E. coli) layers] is visualized with CLSM. Scale bar for the vertical dimension, 20 μm. c Maximum pressures produced by different bacteria; E. coli JM105 (n = 9); E. coli CFT073 (n = 7); P. aeruguinosa (n = 4); S. cohnii (n = 5). d Distributions of rpoH expression-reporting GFP fluorescence intensity per pixel in a WFM image of a chamber (in arbitrary units ranged 25 to 225) at various time points, starting 3.5 h after seeding cells into the chamber. The arrow (t = 4.5 h) indicates when the chamber is completely filled with cells. The color of the plot shows the mean intensity at the corresponding time point. e The integral fluorescence of bacterial colony in the chamber divided by the chamber volume measured at the same time point. The data is normalized to the time point just before the roof deformation becomes detectable (t = 4.5 h in Fig. 1d) (n = 3). f GFP expression due to rpoH upregulation measured from xy-sections of confocal imaging. The data was normalized to the time point when roof deformation started to become measurable (t = 6.5 h in Fig. 1b, indicated by the blue arrow) (n = 3). Error bars are SD

