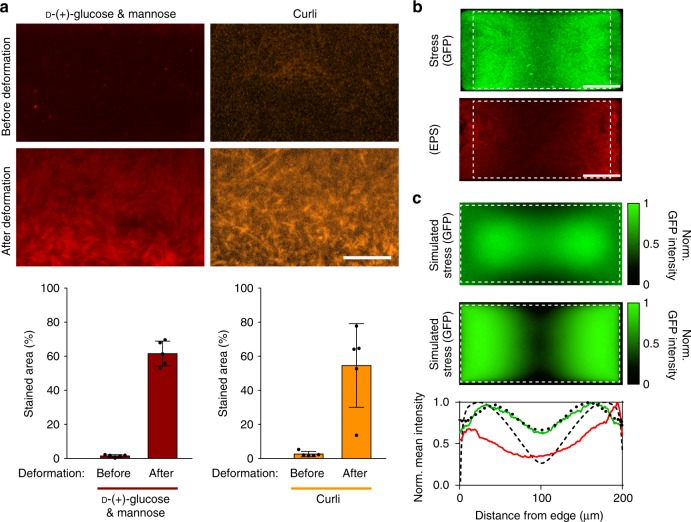
Fig. 2.
Spatial correlation between expression of biofilm-associated cell surface structures and biochemical stress response. a Expression of biofilm-associated cell-surface structures, EPS d-(+)-glucose and mannose groups (red) and curli (orange), as detected using rhodamine-labeled concanavalin A (10 µg/mL) and Congo Red dye (10 µg/mL), respectively, before (top row) and after (bottom row) roof deformation in uropathogenic E. coli populations. Scale bar, 10 µm. Bar graphs show major increases in expression of biofilm-related factors after roof deformation (n = 5). Error bars are SD. b Spatial distribution of GFP, as a reporter of rpoH expression, and of rhodamine-labeled concanavalin A (EPS stain) in E. coli JM105 after roof deformation. Dashed lines show boundaries of the deformable roof. Scale bars, 50 µm. c Agent-based (top) and mean field (bottom) simulations of the stress response distribution reproduce the characteristic patterns observed in GFP and EPS expression. The intensity of green color encodes the stress response. The spatial correlation between the experimentally measured expressions of GFP and EPS and simulated stress responses (agent-based: black dotted curve; mean field: black dashed curve) further supports the connection between mechanical stress and biofilm formation

