Fig. 4.
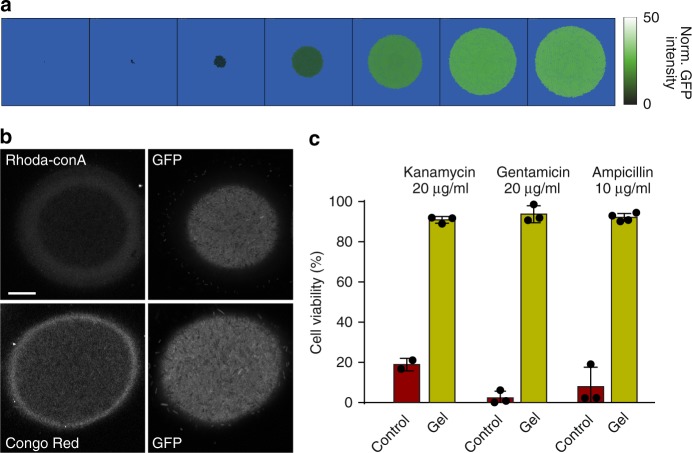
Biofilm growth in environment with mechanical resistance. a Filmstrip of a simulated colony growing in hydrogel. The green color scale encodes the level of stress response. b Spatial distributions of stress-reporting GFP and biofilm-like cell-surface structures in E. coli (JM105) colonies grown in 1% PuraMatrix hydrogel. CLSM was used to visualize both the rhodamine-labeled concanavalin A-stained EPS d-(+)-glucose and mannose groups and the Congo Red-stained curli after ~6 h of growth. Scale bar, 20 µm. c Viability comparison between planktonic and 6 h hydrogel cultures after exposure to 20 μg/mL of kanamycin (JM105) (n = 2 for control, n = 3 for gel), 20 μg/mL of gentamicin (CFT073) (n = 3), and 10 μg/mL of ampicillin (CFT073) (n = 3 for control, n = 4 for gel). Error bars are SD

