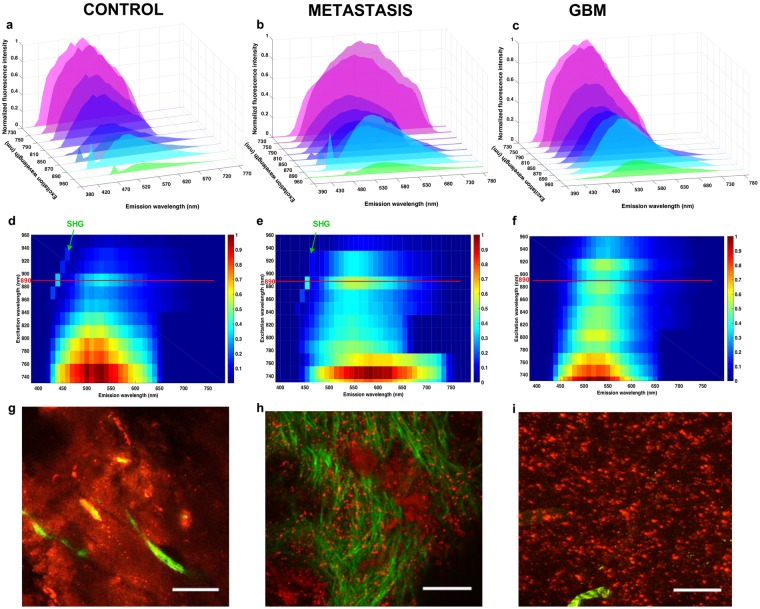
Figure 3.
Analysis of emitted fluorescence for the different groups. (a–c) Topological representation of the emitted fluorescence spectra at different excitation wavelengths for the control (a,d,g), the metastasis (b,e,h) and the GBM (c,f,i) groups. (d–f) Represent colormaps of the Emission-Excitation matrix for each type of tissue. The ideal excitation wavelength is highlighted by a red line and the part of the map corresponding to the SHG signal is identified by a green arrow. TPEF images (g–i) of the selected region is also shown with a scale bar of 100 microns.

