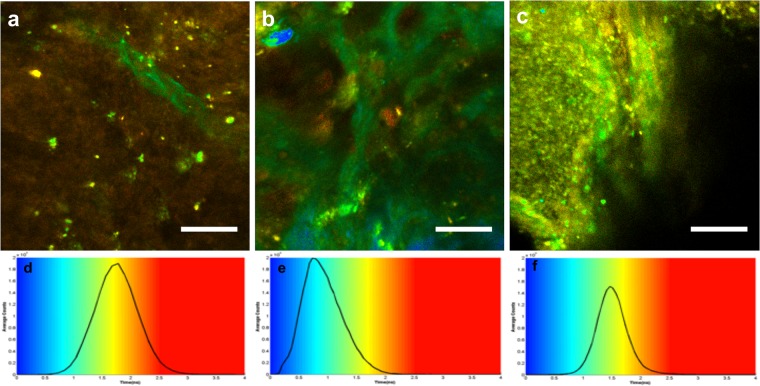
Figure 5.
FLIM representation at 890 nm for each tissue type. (a–c) FLIM images of control sample (a), metastasis sample (b), and GBM (c). Scale bars of 100 μm, (d–f) give the color scale of FLIM imaging with the histogram of the average lifetime; shorter lifetimes (blue) are on the left side of the color scale, and longer lifetime (red) on the right side, two measurements were taken and the full width at half maximum of distribution and the average lifetime of the maximum. SHG is not a fluorescent but diffusing process, appearing as very short lifetime corresponding to the instrument response function (IRF), which is of the order of 0.06 ns and shown in blue in the FLIM images. The typical vascular structures of each tissue are consequently as recognizable as in the TPEF images.

