Fig. 2.
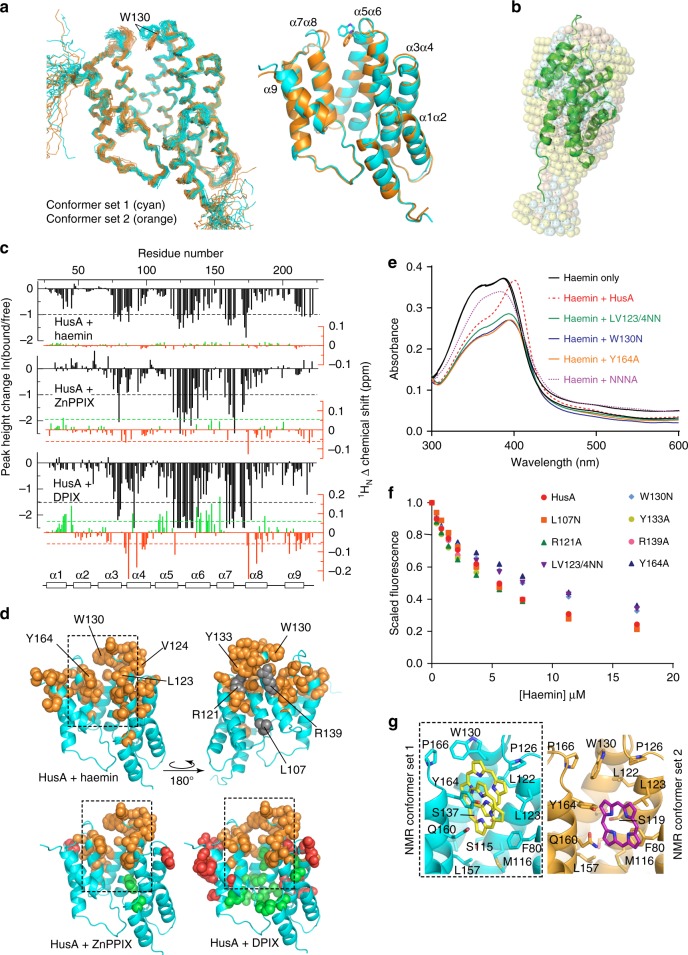
The structure of HusA and analysis of the porphyrin/haem binding site. a Ensembles (stick backbone representation) of HusA conformer set 1 (cyan) and alternative conformer set 2 (orange; 20 lowest energy structures in each) calculated in cyana 3, and the energy minimized average structures (ribbons) showing different orientations of the W130 side chain and adjacent α7α8 loop. b Superimposed DAMMIN models from SAXS data (semi-transparent pink, cyan and yellow spheres for HusA in reduced and standard buffers and HusA:haem, respectively) overlaid with the representative NMR structure (ribbon). c Mapping the porphyrin-binding site in HusA. NMR signal intensity changes (black) and 1HN chemical shift perturbations (CSPs; red/green), measured from 15N-HSQC spectra (Supplementary Figures 9–11 and Supplementary Table 5) upon addition of haemin or ZnPPIX or DPIX. Signal intensity changes are plotted for a HusA:porphyrin molar ratio of 2:1. CSPs were measured for detectable signals with porphyrin in molar excess. d Residues experiencing a reduction in NMR signal (orange) or up-field CSP (red) or down-field CSP (green) above thresholds shown in c (dashed lines) are shown as spheres. Side chains that were mutated are annotated. e UV-visible spectra of 10-μM haemin, alone or in the presence of 10-μM HusA or HusA mutants, recorded at pH 8.0. f Scaled and corrected fluorescence at 335 nm recorded from titrations of HusA or HusA mutants (1 μM concentration) with increasing concentrations of haemin. Measured fluorescence data points (symbols) were fitted to a 1:1 binding model (Supplementary Figure 14). g Representative pooled results for docking a porphyrin ligand (haemin, PPIX or DPIX) to the energy minimized average structure of HusA NMR conformer set 1 (cyan) or HusA NMR conformer set 2 (orange) showing the range of poses adopted (yellow, purple sticks). Only the position of the porphyrin ring, which was similar for haemin, PPIX or DPIX, is shown. Cluster analysis of all docking results is shown as Supplementary Figure 20a

