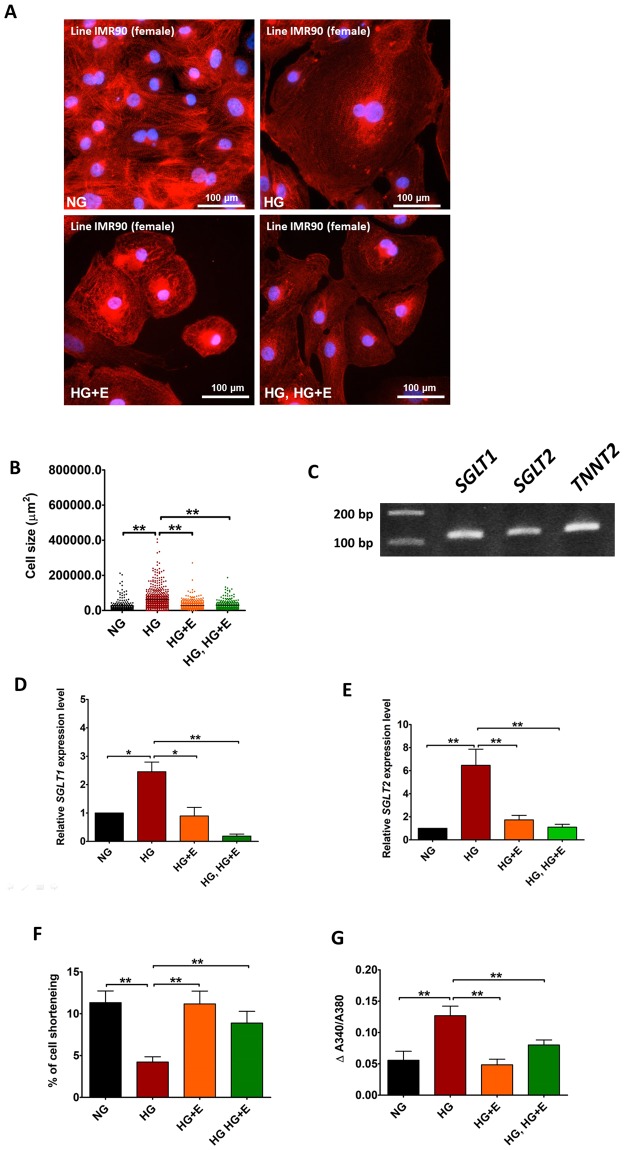
Figure 8.
Effects of High glucose and empagliflozin on the functional alterations of cardiomyocytes derived from IMR90 hiPSCs. (A) Representative immunofluorescence staining, and (B) cell size of IMR90 hiPSC-derived cardiomyocytes cultured in normal glucose (5.5 mM); high glucose (22 mM); high glucose and empagliflozin; and high glucose for 7 days followed by empagliflozin (Red: α-Actinin; blue: DAPI). (C) Existence of SGLT1 and SGLT2 transcripts in the IMR90 hiPSC-derived cardiomyocytes were evaluated by PCR analysis. (D,E) Real-time quantitative PCR analysis of SGLT1 and SGLT2 expression. (F) % of cell shortening. (G) Amplitude of intracellular calcium trainsets. *p < 0.05; **P < 0.01.

