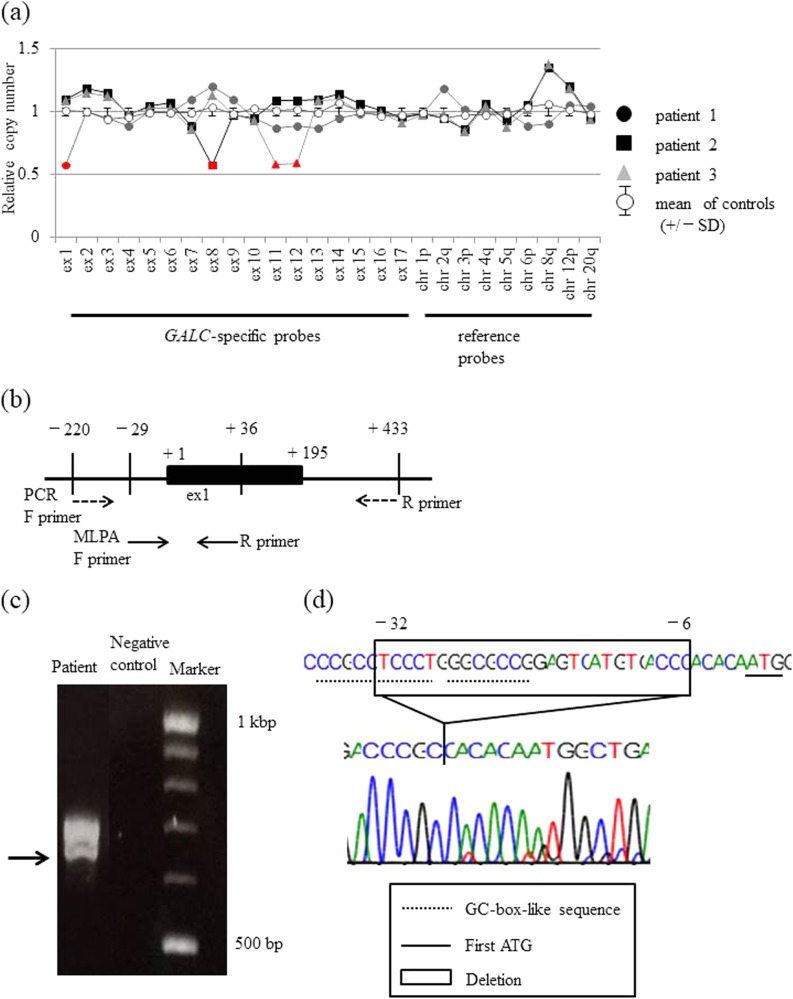
Fig. 1. Detection of GALC exon 1–14 deletions/duplications by MLPA in GLD patients and a normal control, and a detailed analysis of the GALC gene deletion region in patient 1.
a The panels show the results of the MLPA analyses. The deletions are shown in red. Deletions are detected as a 0.5-fold decrease in the peak height compared with the normal control. b The location of each primer used in the MLPA (solid arrow) and PCR (dashed arrow) analyses of exon 1. The analysis region in the PCR assay covers the region of the MLPA analysis. c Electrophoresis of GALC exon 1 and the region upstream of exon 1. The arrow indicates the smaller band corresponding to the mutant allele. d The nucleotide sequence of the lower band in c. The original sequence is shown at the top, and the sequence of the lower band in c is shown underneath. The region deleted in patient 1 is shown in the box

