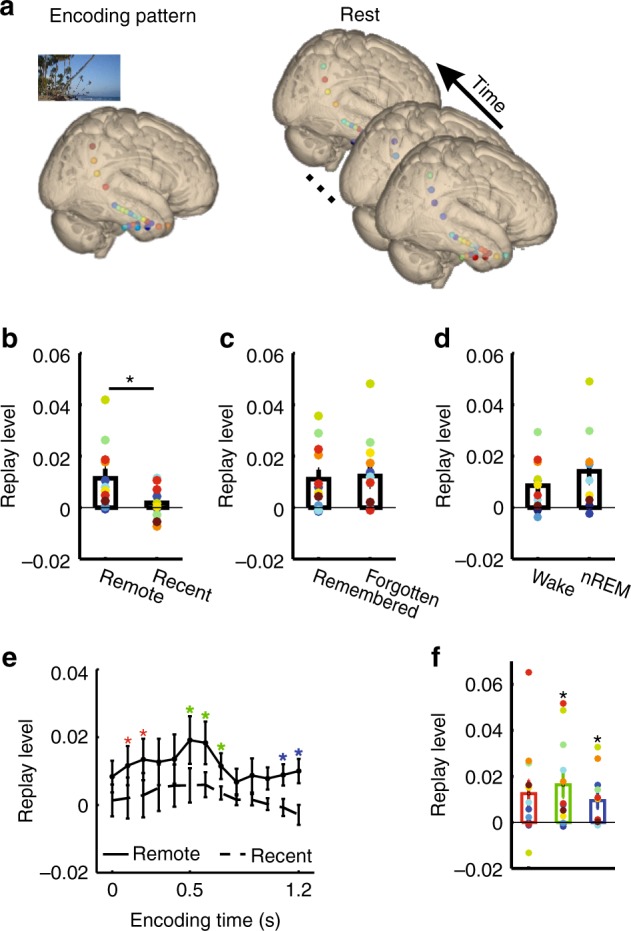
Fig. 3.

Spontaneous replay during rest. a Schematic illustration of analysis procedure. Reactivation is quantified by correlating activity during each encoding event and each time period during the resting state. Each circle in the brain indicates one channel. The hotter the color of the circle, the higher the EEG power. b Higher replay of stimulus-specific activity from late encoding cluster (500–1200 ms) of remote vs. recent items. * indicates p < 0.05 (paired t test). Reactivation does not differ between remembered and forgotten remote items c or between waking state and nREM sleep d. e Encoding-time resolved replay during rest. Reactivation differs between remote and recent items in three time periods marked with *s in different colors after cluster-based correction for multiple comparisons (surrogate data was generated by switching remote and recent labels). f Averaged replay levels of all clusters depicted in e as compared to zero. Each colorful dot indicates one participant. Same colors indicate data from the same participant. Error bars, standard error of the mean; * indicates significant difference from zero (one sample t-test, p < 0.05)
