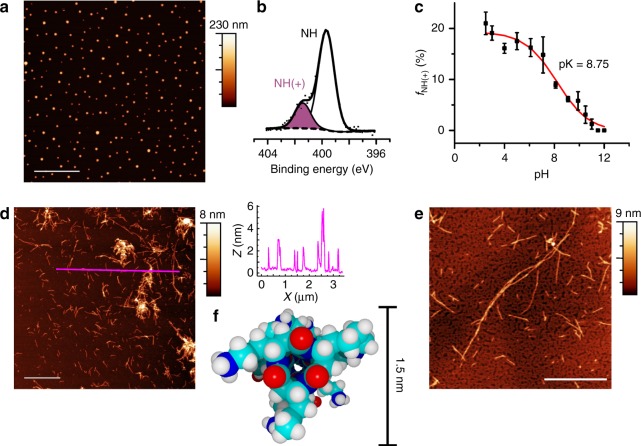
Fig. 3.
pH response of the cyclic β-tripeptide polymer. a AFM image (5 µm scale bar) of polymer deposited on mica from a 1 mg mL−1 solution in 0.1 M acetic acid (pH = 2.9). Color bar indicates the Z heights in the images, with the baseline (black) set to 0 nm. b N 1s XPS spectrum collected from the polymer-coated substrate shown in (a). c Fraction of protonated amino groups (fNH(+)), as determined by XPS, in thick polymer films deposited on gold from 0.1 M sodium phosphate buffers with pHs ranging from of 2.5–12.0. Data points (mean ± SD; N = 3) are fit to a sigmoid curve (see Methods section)28, to determine the pK. AFM images of the polymer deposited on (d) mica (1 µm scale bar) and (e) graphite (500 nm scale bar) from a 1.0 mg mL−1 aqueous solution after NH4OH vapor diffusion (pH ≈ 11); height profile along the magenta line is shown to the right (d). f Cross-sectional view of a molecular model of the synthesized cyclic β-tripeptide polymer

