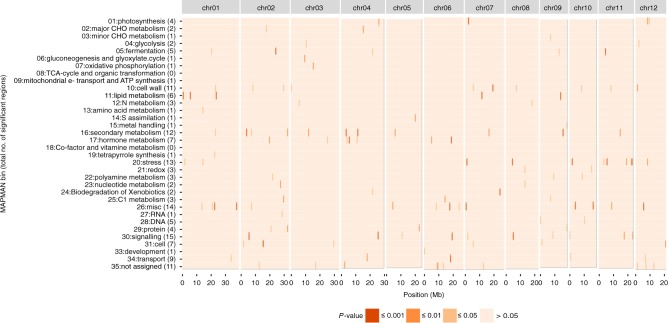
Fig. 5.
Functional enrichment in genomic regions. The O. longistaminata genome was divided into 654 regions of 0.5 Mb each. Within each region, the number of genes associated with MAPMAN functional categories shown on the left was determined. Significant enrichment of functional categories was tested by Fisher’s exact test and P-values were corrected by the Bonferroni–Holm method. P-values for each genomic region (x-axis) and functional category (y-axis) are color-coded according to common significance thresholds as indicated in the legend

