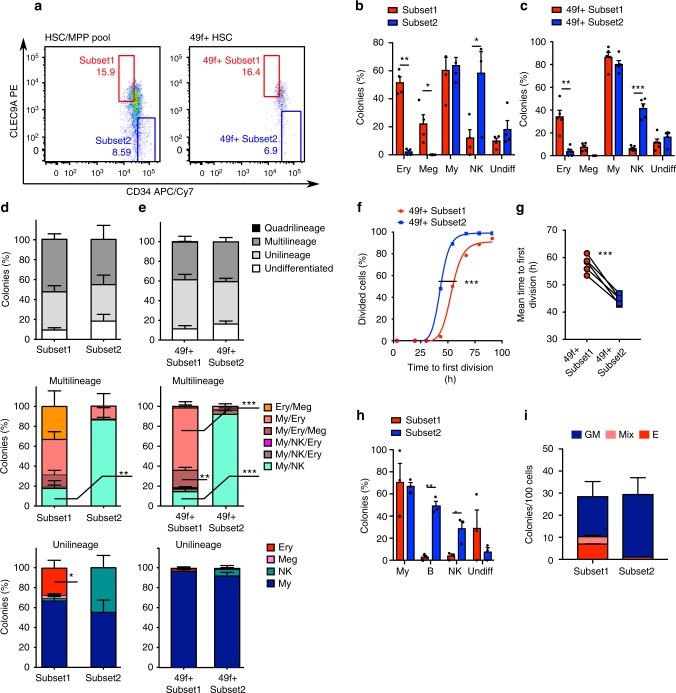
Fig. 2.
Prospective purification of HSC/MPP pool and 49f+ HSC cells with distinct in vitro differentiation capacity. a Representative examples of the gating strategy derived from in silico analysis used to isolate the indicated populations. b–e Single cells were plated in the same assay as in Fig. 1a–f. Percentage of colonies containing differentiated cells of the indicated lineages, generated by single Subset1 (red) or Subset2 cells (blue) (b) and by single 49f+ Subset1 (red) or 49f+ Subset2 cells (blue) (c). Percentage of colonies of the indicated types derived from Subset1 and Subset2 (d) and from 49f+ Subset1 and 49f+ Subset2 single cells (e). n = 4 independent CBs, n = 270 colonies from Subset1, n = 171 colonies from Subset2 (b, d). n = 5 independent CBs, n = 628 colonies from 49f+ Subset1, n = 522 from 49f+ Subset2 (c, e). Mean ± SEM is shown *p < 0.05, **p < 0.01, ***p < 0.001 by two-sided paired t-test (b–e). f Representative example of cumulative first division kinetics of 49f+ Subset1 (red) and 49f+ Subset2 (blue) single cells. Curves are a non-linear least squares ordinary fit (non-log); ***p < 0.001 by extra sum of squares F-test. g Mean time to first division of 49f+ Subset1 (red) and 49f+ Subset2 (blue) (EC50 of non-linear fit of cumulative first division kinetics as in f); n = 5 independent experiments each with an independent CB (with, respectively, 384, 384, 360, 150 and 192 single cells per experiment); ***p < 0.001 by two-sided paired t-test. h Cells were plated in an assay supporting differentiation of My, B and NK cells. Percentage of colonies generated by Subset1 (red) or Subset2 (blue) single cells and containing differentiated cells of the indicated lineages; mean ± SEM is shown, n = 3 independent CBs (Subset1 138 colonies, Subset2 142 colonies), *p < 0.05, **p < 0.01 by two-sided paired t-test. i Number of colonies/100 cells from either Subset1 or Subset2 populations plated in a CFU assay. The type of colony: erythroid (E), granulocyte and myeloid (GM) or a combination of both (mix) is shown, (n = 2 independent CBs); mean ± SEM is shown

