Figure 1.
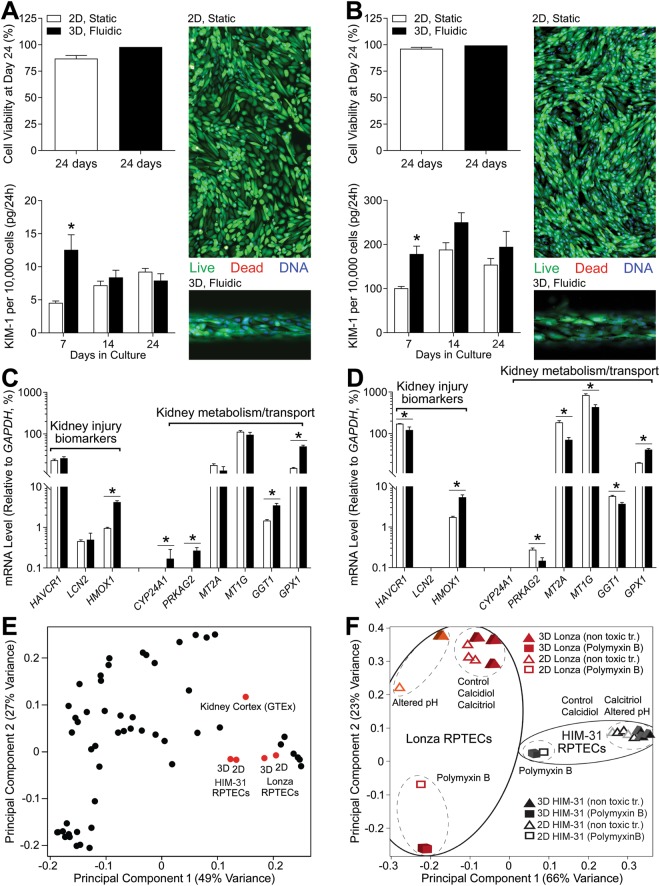
Long-term culture of RPTEC under 3D and 2D conditions. Cell viability and KIM-1 secretion in 2D and 3D (A) HIM-31 and (B) Lonza RPTEC cultures. Baseline gene expression in (C) HIM-31 and (D) Lonza RPTEC cultures, highlighting differences between 2D and 3D culture in expression of kidney injury biomarkers, and metabolism and transport markers. (E) Principal component analysis demonstrating grouping between cell sources and culturing conditions in comparison to GTEx human kidney cortex tissues. Black data points represent other human tissues within GTEx. (F) Principal component analysis of 2D and 3D cell cultures, demonstrating grouping within cell source, and toxic (polymyxin B) vs non-toxic (controls, calcidiol, calcitriol, and altered pH) exposure conditions. (*p < 0.05, 2-tailed t-test).

