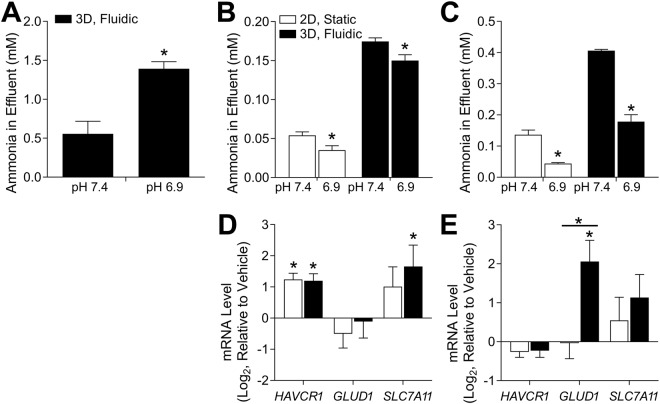
Figure 2.
Ammoniagenesis in response to altered pH. Initially, media was at a pH of 7.4, and was changed to 6.9 to determine differences in ammonia secretion between conditions. Ammonia concentration in effluent is shown in (A) the previous publication13, (B) HIM-31, and (C) Lonza RPTECs. Additionally, expression of select genes is shown in (D) HIM-31, and (E) Lonza RPTECs as log2fc relative to vehicle. (*Differentially expressed gene compared to vehicle, p < 0.05, 2-tailed t-test).

