Figure 4.
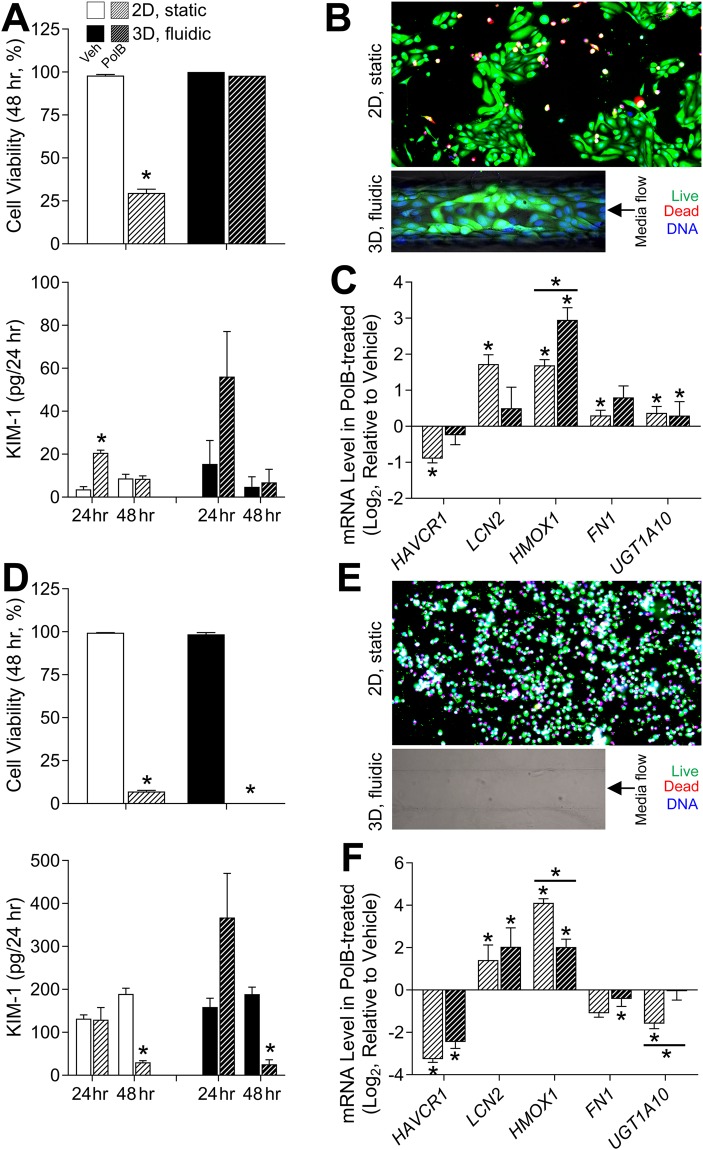
Polymyxin B toxicity in 2D and 3D cultures of HIM-31 (A–C) and Lonza (D–F) RPTECs. A and D: Cell viability and KIM-1 secretion in vehicle (solid white or black) and polymyxin B (50 μM, hashed white or black) treated (24 and 48 hrs) HIM-31(A) and Lonza (D) RPTECs in 2D (white) and 3D (black) cultures. Asterisks (*) denote statistical difference (p < 0.05, 2-tailed t-test) between groups. B and E: Representative images of calcein (green), ethidium (red), and Hoechst (blue) fluorescent staining in HIM-31(B) and Lonza (E) RPTECs in 2D and 3D that were exposed to polymyxin B (50 μM) for 48 hrs. C and F: Expression of genes involved in acute kidney injury was quantified in HIM-31 (C) and Lonza (F) RPTECs in 2D and 3D. Differentially expressed genes (relative to vehicle for each condition) are denoted with an asterisk (*), and significant differences between 2D and 3D cultures are denoted with an asterisk (*) and a bar.

