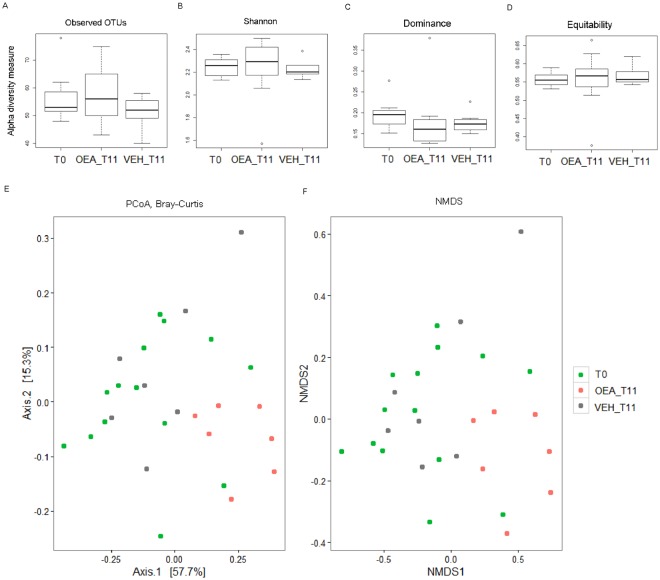
Figure 2.
Alpha and Beta diversity. (A–D) Alpha diversity measures. Box plots of (A) observed OTUs, (B) Shannon index, (C) Dominance, and (E) Equitability calculated for mice groups at T0 = before the treatment, after 11 days of OEA treatment (OEA_T11) and after 11 days of vehicle treatment (Vehicle_ T11). Pairwise comparisons by using the Wilcoxon rank sum test were not significant. (E-F) Beta diversity measure. (E) PCoA, and (F) NMDS based on Bray Curtis dissimilarities. Samples at T0, samples of OEA_T11 and Vehicle_T11 are indicated with different colours. P = 0.035 PERMANOVA using the Adonis function with 999 permutations. For NMDS, stress value=0.09 indicated a good representation.

